Bitcoin Just Dropped a Message. Ignore It at Your Own Risk 🚨
Bitcoin just did it.
Yes, it finally broke the big ascending trendline that had been guiding the market for months. And not by accident. This break comes exactly 18 months after the halving, a moment we had already discussed in earlier articles.

For many cycles, the 18-month mark has signaled exhaustion, a point where trends weaken and a deeper shift begins. This time, BTC respected the pattern again.

Each line is a BTC cycle starting at each halving. Except the first one which was ver y fast and agressive, all cycles end at the 18 months mark. And just look what happens during the next year... a kid could see the pattern!!
But let’s zoom in.
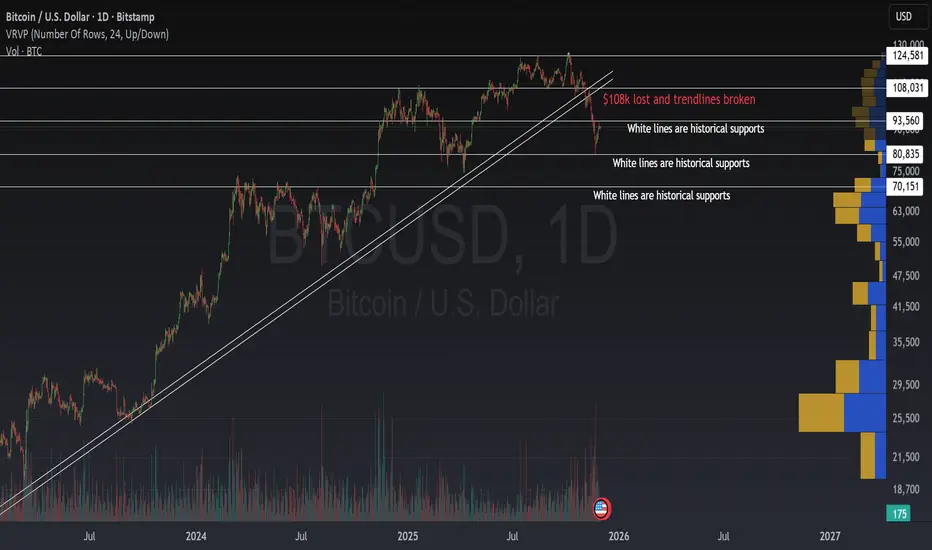
On the chart, BTC didn’t just break the trendline. It also lost the $108k level, a key resistance-turned-support that buyers had protected again and again.
Once that level was gone, the chart opened the door for lower levels.
And guess what? Bitcoin has been touching, and respecting, every one of the white historical support lines drawn on the chart.
This behavior is not random.
This is structure.
This is how big money moves, and you must do the same to stay alive.

In the previous article, I showed you how institutions mark their buying and selling levels. These are zones where the risk-reward becomes exceptional. The difference between knowing them and ignoring them is simple:
👉 If you don’t know these levels, you’re trading blind.
That’s why BTC is reacting exactly where it should. These white support lines aren’t just lines. They are footprints, the footprints of the players who actually move the market.
So… What Now?
This is not the end of the story, it’s the setup for the next chapter and a confirmation of what will happen NEXT.
I will share the exact levels where this drop should end and WHEN, not only the price, but also how to profit from the next move with low risk as we have been done this whole year in the bull market.
We are entering one of those rare moments where the market gives a clear map, if you know how to read it.
Stay sharp. Stay ready. The next big opportunity is closer than most think.
🚀 Check my signature to learn more!!
Bitcoin just did it.
Yes, it finally broke the big ascending trendline that had been guiding the market for months. And not by accident. This break comes exactly 18 months after the halving, a moment we had already discussed in earlier articles.
For many cycles, the 18-month mark has signaled exhaustion, a point where trends weaken and a deeper shift begins. This time, BTC respected the pattern again.
Each line is a BTC cycle starting at each halving. Except the first one which was ver y fast and agressive, all cycles end at the 18 months mark. And just look what happens during the next year... a kid could see the pattern!!
But let’s zoom in.
On the chart, BTC didn’t just break the trendline. It also lost the $108k level, a key resistance-turned-support that buyers had protected again and again.
Once that level was gone, the chart opened the door for lower levels.
And guess what? Bitcoin has been touching, and respecting, every one of the white historical support lines drawn on the chart.
This behavior is not random.
This is structure.
This is how big money moves, and you must do the same to stay alive.
In the previous article, I showed you how institutions mark their buying and selling levels. These are zones where the risk-reward becomes exceptional. The difference between knowing them and ignoring them is simple:
👉 If you don’t know these levels, you’re trading blind.
That’s why BTC is reacting exactly where it should. These white support lines aren’t just lines. They are footprints, the footprints of the players who actually move the market.
So… What Now?
- A broken trendline.
- A lost $108k.
- A dance on historical supports.
- A perfect timing of the Top of the cycle.
This is not the end of the story, it’s the setup for the next chapter and a confirmation of what will happen NEXT.
I will share the exact levels where this drop should end and WHEN, not only the price, but also how to profit from the next move with low risk as we have been done this whole year in the bull market.
We are entering one of those rare moments where the market gives a clear map, if you know how to read it.
Stay sharp. Stay ready. The next big opportunity is closer than most think.
🚀 Check my signature to learn more!!
⚡ Trading is not about luck or patience. Is about skills and knowledge. ⚡
I share my ideas, returns and knowledge here:
📚 👉 topchartpatterns.substack.com/subscribe 👈📚
🤝 Business contact: info@topchartpatterns.com
I share my ideas, returns and knowledge here:
📚 👉 topchartpatterns.substack.com/subscribe 👈📚
🤝 Business contact: info@topchartpatterns.com
Похожие публикации
Отказ от ответственности
Информация и публикации не предназначены для предоставления и не являются финансовыми, инвестиционными, торговыми или другими видами советов или рекомендаций, предоставленных или одобренных TradingView. Подробнее читайте в Условиях использования.