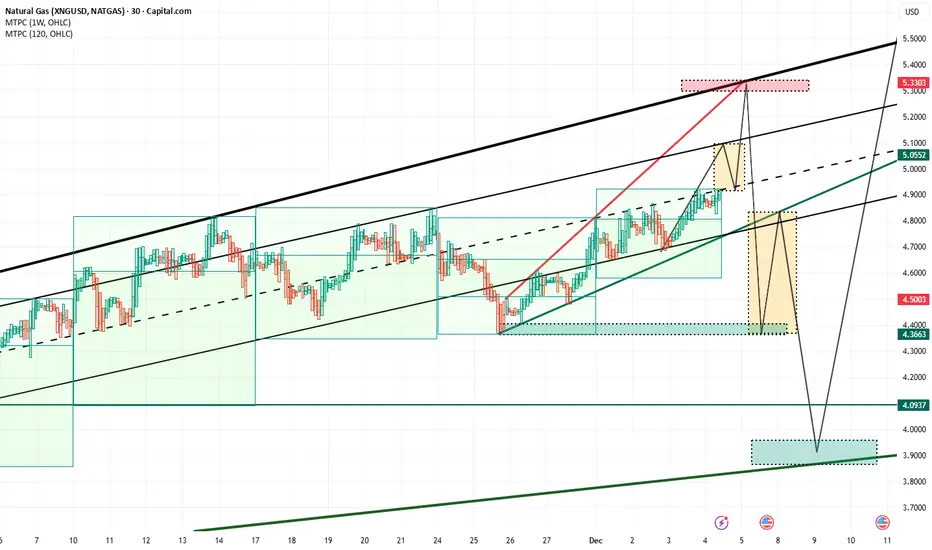
A push toward the upper channel boundary and the key resistance area at 5.30–5.33 USD remains the dominant scenario. An interim dip is possible on the way up, with a potential retracement forming anywhere between 5.08 and 4.92 USD.
If the price reaches the 5.30–5.33 USD zone on Friday and gets rejected while the main support holds, the weekly candle would turn into a clear reversal signal. forming a strong Weekly reverse Candle.
A break of this support in the following week would then open the path toward the 4.0–3.9 USD region, which stands out as the most probable deeper pullback area.
On the descent toward that zone, a sharp corrective bounce from around 4.36 back toward approximately 4.80 USD is highly plausible.
It remains a game of probabilities: a decline can unfold from 5.00 or even 5.20 USD, and both scenarios remain entirely possible. The exact outcome will depend on how the price behaves as it approaches these levels and which of the following market reactions takes shape.
Отказ от ответственности
Информация и публикации не предназначены для предоставления и не являются финансовыми, инвестиционными, торговыми или другими видами советов или рекомендаций, предоставленных или одобренных TradingView. Подробнее читайте в Условиях использования.
Отказ от ответственности
Информация и публикации не предназначены для предоставления и не являются финансовыми, инвестиционными, торговыми или другими видами советов или рекомендаций, предоставленных или одобренных TradingView. Подробнее читайте в Условиях использования.