A simple and clear analysis of the Sun Pharma weekly chart based on trend, volumes, momentum, RSI, ADX, and chart structure:
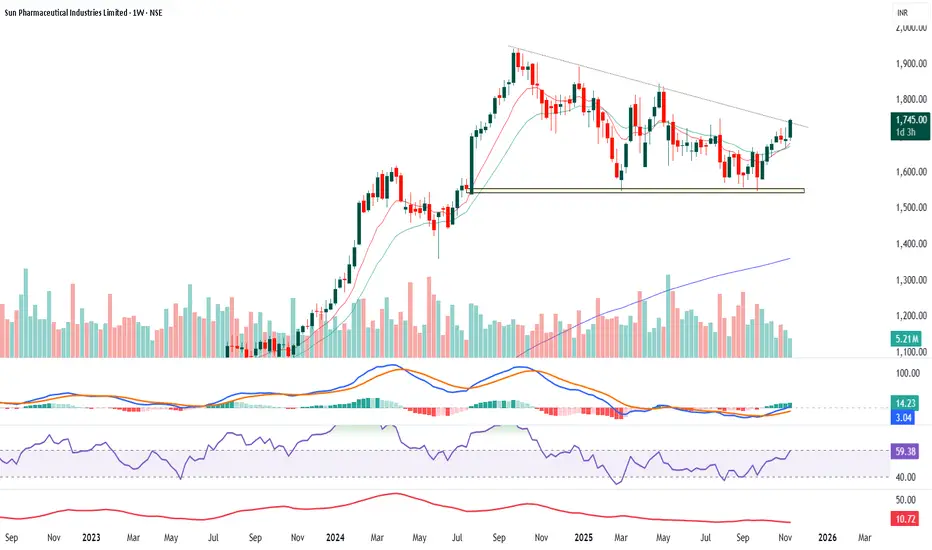
Trend: The stock has been in a broad consolidation for many months. It was making lower highs, forming a downward sloping trendline. Now the price is trying to break above that trendline. This shows the first sign that the downtrend may be ending and a fresh upward move may start. The long-term trend is still positive because the price has stayed above the major support zone around 1550–1600.
Chart pattern : The chart is showing a descending trendline with multiple touch points. The stock has bounced strongly from the support zone and is now testing the trendline. A clean breakout above this trendline will confirm a trend reversal.
Volumes: Volumes have been stable but not very strong. However, during recent green candles, volumes have slightly increased, which shows buying interest returning slowly. A breakout with higher volume will give more confidence.
Momentum (MACD)
The MACD has crossed above the signal line, which indicates bullish momentum building up. The histogram turning green also supports the idea that the momentum is improving.
RSI : RSI is around 59, which means the stock is gaining strength but is still not overbought. This is a healthy zone for an early-stage uptrend.
ADX : ADX is around 10, which indicates that the current trend strength is weak. It means the stock was in a range for a long time. As price breaks out and ADX starts rising, the new trend will get stronger.
Overall view : Sun Pharma is showing early signs of a trend reversal. Price is near a trendline breakout, momentum indicators have turned positive, RSI is rising, and the stock is holding a strong support zone. A confirmed breakout above the trendline with good volume can start a fresh upward move.
Отказ от ответственности
Информация и публикации не предназначены для предоставления и не являются финансовыми, инвестиционными, торговыми или другими видами советов или рекомендаций, предоставленных или одобренных TradingView. Подробнее читайте в Условиях использования.
Отказ от ответственности
Информация и публикации не предназначены для предоставления и не являются финансовыми, инвестиционными, торговыми или другими видами советов или рекомендаций, предоставленных или одобренных TradingView. Подробнее читайте в Условиях использования.