Legend
Legend is a list of series and indicators at the top-left corner of any chart. Note that the legend position cannot be changed.
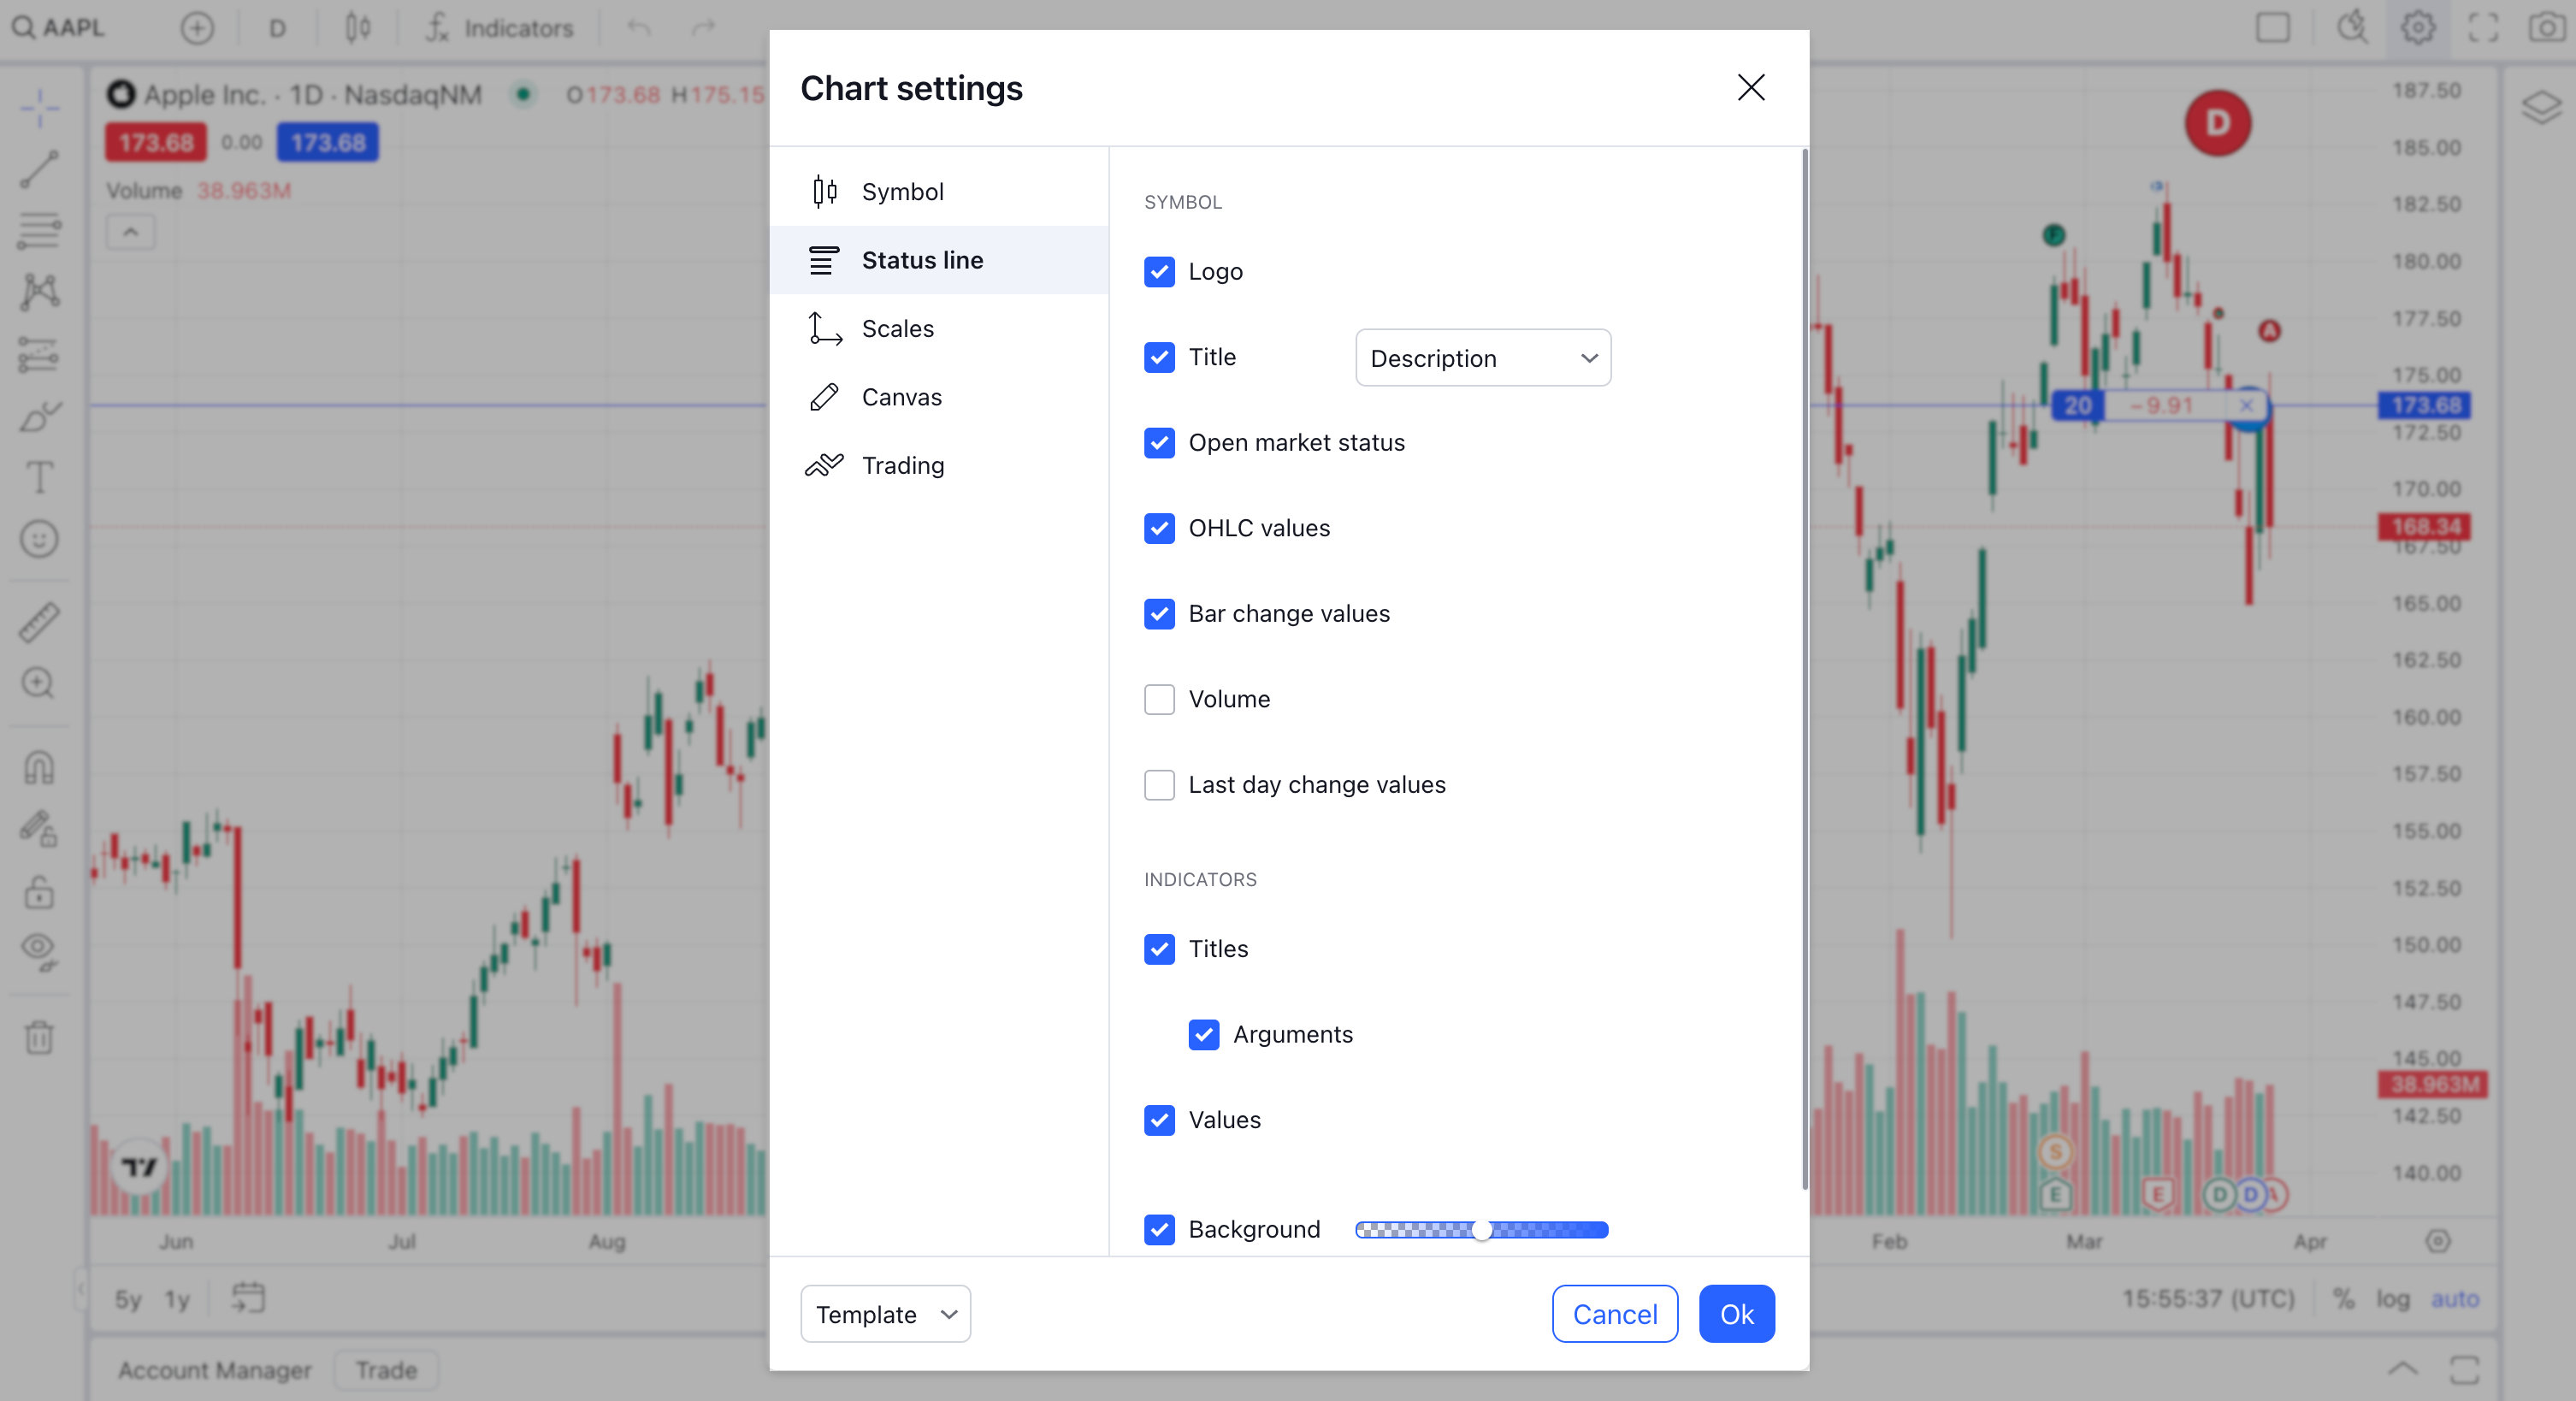
Configure legend
In the Chart settings → Status line dialog, users can configure the legend.
Symbol logos
If you want to display logos for symbols within the legend, follow the steps below:
- Enable the
show_symbol_logosandshow_symbol_logo_in_legendfeaturesets. The Logo option appears in the settings dialog. - Provide URLs for symbols in the
logo_urlsproperty of theLibrarySymbolInfoobject. Pass the object as a parameter to the callback of theresolveSymbolmethod.
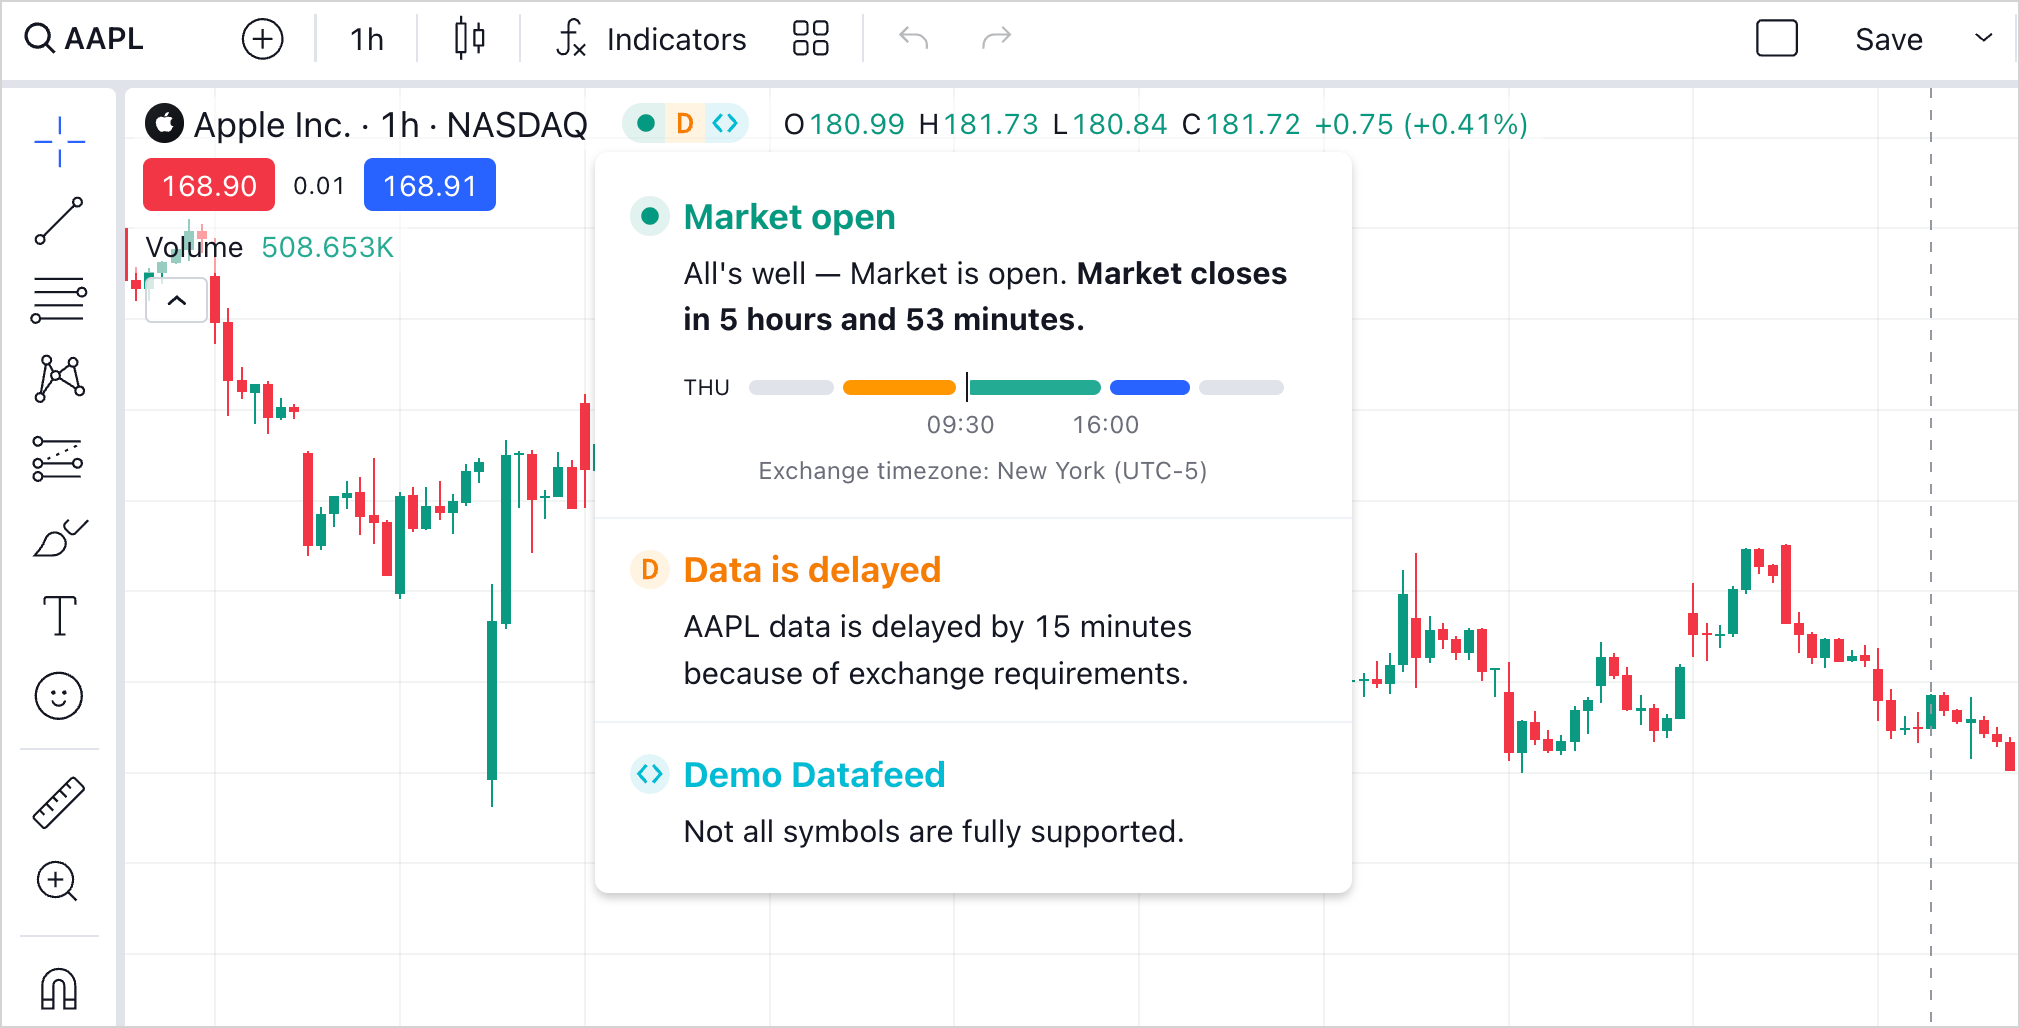
Open market status
By default, the library displays the current market status as an icon within the legend for the main series of the chart.
You can hide the market status by adding the display_market_status featureset to the disabled_features array.
Title
In the Title drop-down, users can select what title to display in the legend:
- Description
- Ticker
- Ticker and description
You can also set the title using the Overrides API. For example, the code sample below sets ticker as the legend title.
chartApi.applyOverrides({ "mainSeriesProperties.statusViewStyle.symbolTextSource": "ticker" })
Last day change values
Last day change can be displayed in Trading Platform only as it requires quote data.
Last day change is a parameter represented by two values: daily change and percentage daily change. You should specify these values in the ch and chp properties of DatafeedQuoteValues
and pass them to the library when it calls getQuotes.
Last day change is displayed in Data Window on the right toolbar. You can also add this parameter to the chart legend using the overrides:
var widget = window.tvWidget = new TradingView.widget({
    // ...
    overrides: {
        "paneProperties.legendProperties.showLastDayChange": true,
    }
});
Users can toggle the Last day change values option in the Chart settings dialog to change the last day change visibility in the legend. This option is hidden by default. To display it, you should enable one of the following featuresets:
legend_last_day_change— adds the extra Last day change values option to the Chart settings dialog.show_last_price_and_change_only_in_series_legend— adds the last day change to the legend and hides the OHLC values. Also, the extra Last day change values option appears in the Chart settings dialog.
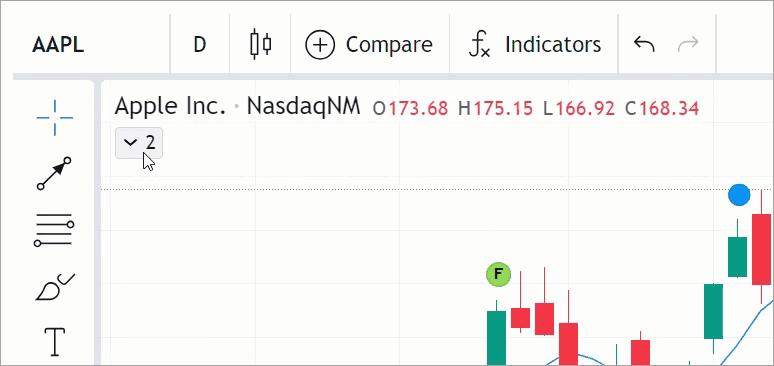
Resolution
To disable resolution changing in the Legend, use the legend_inplace_edit featureset.
If you want to completely remove the Resolution button from the Legend, use the hide_resolution_in_legend featureset.
Visibility customization
You can use featuresets or overrides to customize the legend's visibility such as hiding or displaying particular legend elements. The sections below describe customization via featuresets. For more information about override properties that affect the legend, refer to Legend.
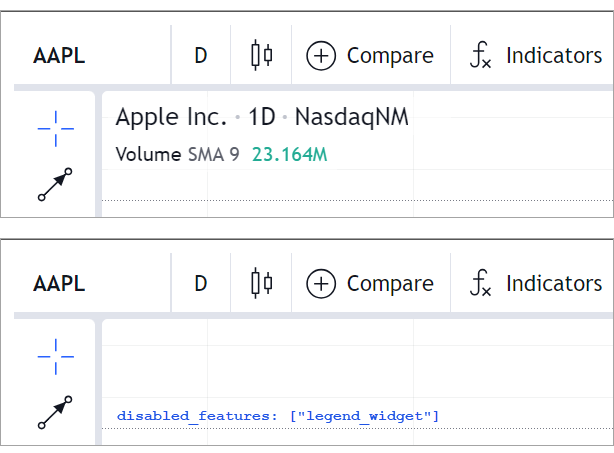
Hide legend
You can hide the legend widget from the chart.
To do this, include the legend_widget featureset in the disabled_features array.
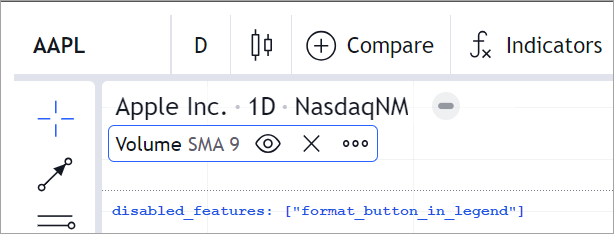
Hide legend buttons
You can hide all legend buttons by including the edit_buttons_in_legend in disabled_features.
Besides, disabling show_hide_button_in_legend, format_button_in_legend,
or delete_button_in_legend allows customizing particular legend buttons.
For example, the Settings button is hidden in the image below.
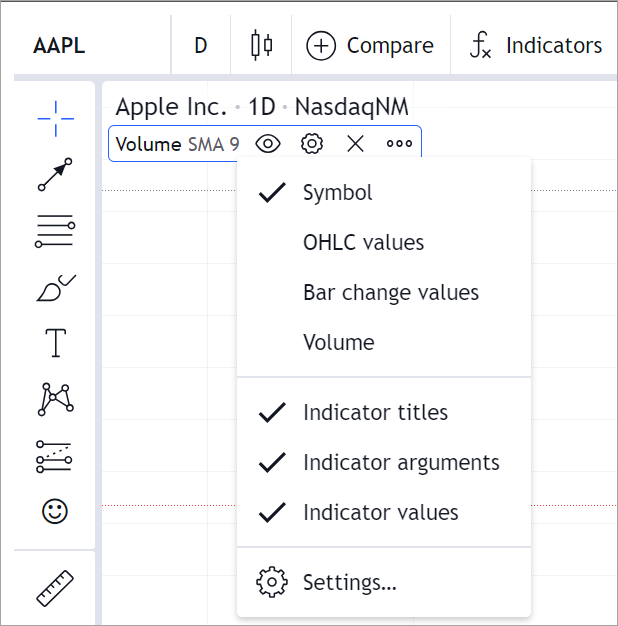
Hide context menu
When right-clicking the legend, you can access the context menu.
To disable this feature, include legend_context_menu in disabled_features.
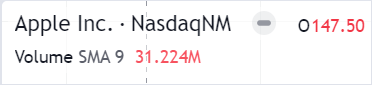
Price formatting
Prices are formatted according to the pricescale, minmov, minmove2, fractional, and variable_tick_size properties specified in the LibrarySymbolInfo object.
For more information, refer to the Price format section.
You can also apply custom formatting using the numeric_formatting property of Widget Constructor.
new TradingView.widget({
    container: "chartContainer",
    locale: "en",
    library_path: "charting_library/",
    datafeed: new Datafeeds.UDFCompatibleDatafeed("https://demo-feed-data.tradingview.com"),
    symbol: "AAPL",
    interval: "1D",
    numeric_formatting: { decimal_sign: "," },
})
In the code sample above, the comma separates the decimal/fractional part of the price.

NaN values in legend
If NaN values appear in the legend instead of the expected data,
ensure that you have implemented the getQuotes and subscribeQuotes methods of the Datafeed API.
This issue appears in mobile applications when running outside of tracking mode.
Outside this mode, the legend shows only three values: the closing price, price change, and price change percentage.
The library retrieves these values from the getQuotes request, otherwise, it displays NaN.
Note that open, high, and low prices and indicator values are displayed in the tracking mode only. To activate this mode, users should long tap on the chart. A single tap on the chart exits this mode.
Display delayed data information
Follow the steps below to enable the Data is delayed section in the legend:
- Add the
display_data_modefeatureset to theenabled_featuresarray of the Widget Constructor object. - Provide the following properties in the
LibrarySymbolInfoobject. Pass this object as a parameter to the callback of theresolveSymbolmethod.data_status– specify"delayed_streaming".delay– specify delay in seconds.
The image below shows the Data is delayed section and the D icon in the legend.