INVITE-ONLY SCRIPT
Trend Detector Indicator
Trend Detector Indicator
Class: trend oscillator/average analysis
Trading type: trading in trend
Time frame: 1 day
Purpose: trend detection
Level of aggressiveness: conservative
The key problem of trend following trading is danger of entering into position at extreme points of the trend with further trend reverse. Plus in any case it is very important to understand the phase of the trend cycle to be effective and successful trader.
Each trend can be divided into several phases: start of the trend, active development, consolidation phase, end of the trend. Obviously the most interesting phases for trading in trend are start and active development of the trend. At these phases risk of unsuccessful trading in trend direction is minimal, but profit opportunities are maximal. Still as a rule it is quite hard to detect the start of the trend. As the result probability of false signals is rather high.
Indicator «Trend Detector Indicator» is developed to identify the active phases of the trend cycle and helps to avoid trading at the end of the trend.
Using unique algorithm Indicator “TDI” allows to identify moments in price dynamics which are the most appropriate for trading in trend.
Structure of the indicator
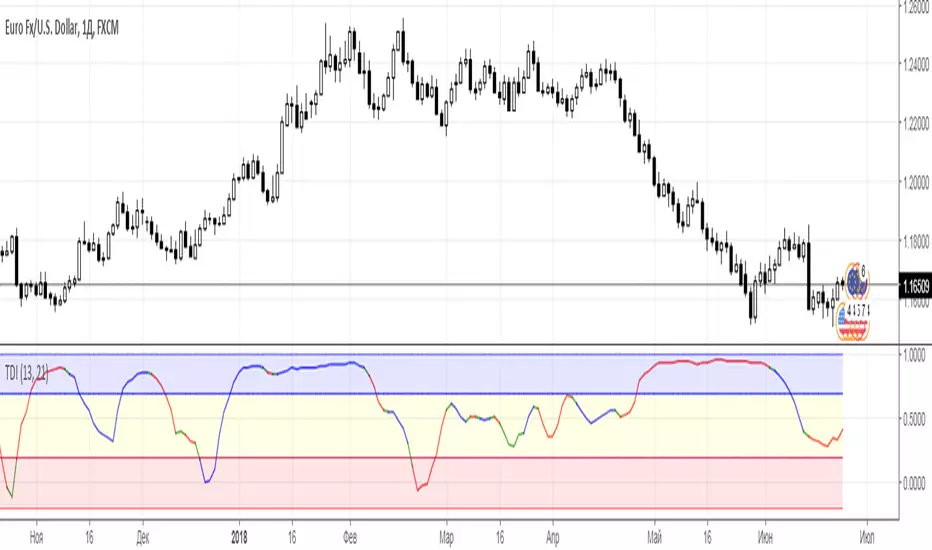
Indicator consists of the TDI line and special colored zones:
- TDI line (multi-colored line in the indicator window) – is used to divide phases of the trend cycle, different colors signal about current type of price dynamics (blue color – uptrend, red color – downtrend, green – flat);
- Colored zones (blue, yellow and red colors depending on type of the signal) – are used for color indication of the trend cycle phases. Blue color means that trend is in active phase. Yellow warns about possible transition of the trend to the extinction. Entering the red zone is a signal of possible break of a trend.
Input parameters of the indicator
To set up the indicator a number of input parameters are used:
- Average period – averaging period. Responsible for the data filtration (by default = 13). The bigger the period is the less quantity of the signals would be, but the higher their quality is expected. Decrease of this parameter allows to increase the aggressiveness of the trading and the number of generated signals, but potentially this can decrease the quality of the signals
- Correlation period – period which is used in correlation analysis to calculate the correlation moment (by default = 21).
Rules of trading
Entering of the TDI line into blue zone and being there is a signal for active trading in current price direction. The direction of the tendency is indicated by the color of the TDI line: blue color – uptrend and “buy” signal, red color – downtrend and “sell” signal, green – flat, that means there is no dominating tendency and trading in trend should be postponed.
Since the basis for the trades are trend signals, their closing with profits or stops should be done when these signals lost relevance. So stop-loss and take-profit parameters are not provided. Such approach allows to avoid profit limitation by a certain number of points and to extract maximum from the active phase of the trend cycle, which is not limited in theory.
Change of the TDI line color in blue zone is a signal to close current long positions. Exit of the TDI line from blue zone is a signal to close current trend positions.
Class: trend oscillator/average analysis
Trading type: trading in trend
Time frame: 1 day
Purpose: trend detection
Level of aggressiveness: conservative
The key problem of trend following trading is danger of entering into position at extreme points of the trend with further trend reverse. Plus in any case it is very important to understand the phase of the trend cycle to be effective and successful trader.
Each trend can be divided into several phases: start of the trend, active development, consolidation phase, end of the trend. Obviously the most interesting phases for trading in trend are start and active development of the trend. At these phases risk of unsuccessful trading in trend direction is minimal, but profit opportunities are maximal. Still as a rule it is quite hard to detect the start of the trend. As the result probability of false signals is rather high.
Indicator «Trend Detector Indicator» is developed to identify the active phases of the trend cycle and helps to avoid trading at the end of the trend.
Using unique algorithm Indicator “TDI” allows to identify moments in price dynamics which are the most appropriate for trading in trend.
Structure of the indicator
Indicator consists of the TDI line and special colored zones:
- TDI line (multi-colored line in the indicator window) – is used to divide phases of the trend cycle, different colors signal about current type of price dynamics (blue color – uptrend, red color – downtrend, green – flat);
- Colored zones (blue, yellow and red colors depending on type of the signal) – are used for color indication of the trend cycle phases. Blue color means that trend is in active phase. Yellow warns about possible transition of the trend to the extinction. Entering the red zone is a signal of possible break of a trend.
Input parameters of the indicator
To set up the indicator a number of input parameters are used:
- Average period – averaging period. Responsible for the data filtration (by default = 13). The bigger the period is the less quantity of the signals would be, but the higher their quality is expected. Decrease of this parameter allows to increase the aggressiveness of the trading and the number of generated signals, but potentially this can decrease the quality of the signals
- Correlation period – period which is used in correlation analysis to calculate the correlation moment (by default = 21).
Rules of trading
Entering of the TDI line into blue zone and being there is a signal for active trading in current price direction. The direction of the tendency is indicated by the color of the TDI line: blue color – uptrend and “buy” signal, red color – downtrend and “sell” signal, green – flat, that means there is no dominating tendency and trading in trend should be postponed.
Since the basis for the trades are trend signals, their closing with profits or stops should be done when these signals lost relevance. So stop-loss and take-profit parameters are not provided. Such approach allows to avoid profit limitation by a certain number of points and to extract maximum from the active phase of the trend cycle, which is not limited in theory.
Change of the TDI line color in blue zone is a signal to close current long positions. Exit of the TDI line from blue zone is a signal to close current trend positions.
Скрипт с ограниченным доступом
Доступ к этому скрипту разрешён только для пользователей, авторизованных автором, и для этого обычно требуется оплата. Вы можете добавить скрипт в список избранных, но использовать его можно будет только после запроса на доступ и получения разрешения от автора. Свяжитесь с Trade24Fx, чтобы узнать больше, или следуйте инструкциям автора ниже.
TradingView не советует платить за скрипт и использовать его, если вы на 100% не доверяете его автору и не понимаете, как он работает. Часто вы можете найти хорошую альтернативу с открытым исходным кодом бесплатно в нашем разделе Скрипты сообщества.
Инструкции от автора
″
Хотите использовать этот скрипт на графике?
Внимание: прочтите это перед тем, как запросить доступ.
Авторские индикаторы
bit.ly/2oBvkHY
Больше информации на нашем ютьюб-канале
youtube.com/channel/UCYEOurJfasXWyYnrriGwsqQ
bit.ly/2oBvkHY
Больше информации на нашем ютьюб-канале
youtube.com/channel/UCYEOurJfasXWyYnrriGwsqQ
Отказ от ответственности
Все виды контента, которые вы можете увидеть на TradingView, не являются финансовыми, инвестиционными, торговыми или любыми другими рекомендациями. Мы не предоставляем советы по покупке и продаже активов. Подробнее — в Условиях использования TradingView.