OPEN-SOURCE SCRIPT
Momentum-Contraction Breakout (MCB) — Indicator
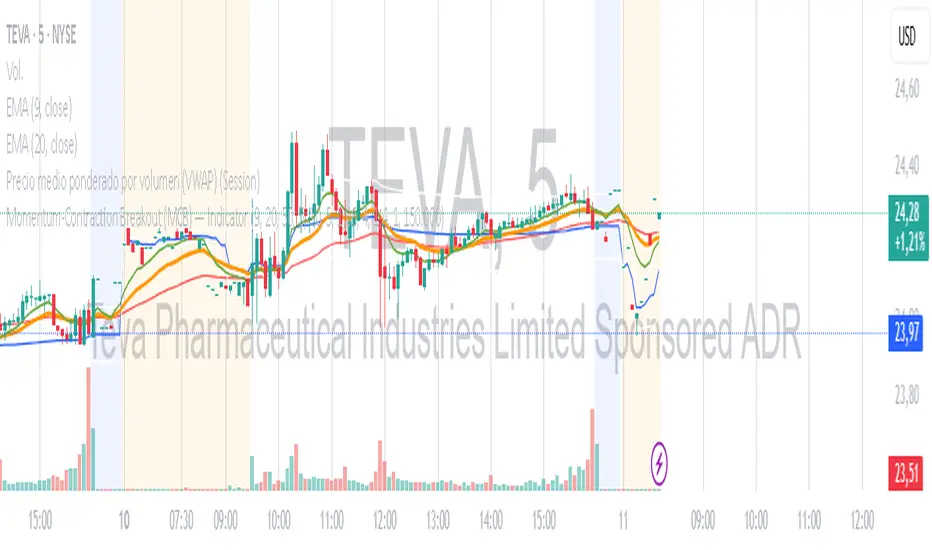
The Momentum-Contraction Breakout (MCB) indicator is designed by joan alcantara to identify high–probability bullish continuation setups based on the sequence Impulse → Contraction → Breakout.
This indicator detects stocks that:
Show early uptrend structure
The short-term EMA is above the mid-term EMA, which is above the long-term EMA, confirming momentum and trend alignment.
Enter a volatility contraction phase
Price forms a controlled pullback of 1–5 candles with decreasing true range and a tight price range, signaling reduced supply and absorption.
Break out with conviction
The breakout is validated when price closes above recent range highs, moves at least a defined % upward, and volume expands above its 20-period average.
When all conditions align, the indicator marks the breakout candle and allows alerts to be triggered.
What this indicator is useful for:
Finding momentum continuation setups early in trend development
Scanning watchlists for high-quality entries
Creating actionable trade alerts for swing and position trading
Supporting systematic setups based on volatility contraction theory
Best used on daily timeframes, but can be adapted to intraday charts when liquidity is sufficient.
Скрипт с открытым кодом
In true TradingView spirit, the creator of this script has made it open-source, so that traders can review and verify its functionality. Kudos to the author! While you can use it for free, remember that republishing the code is subject to our House Rules.
Отказ от ответственности
The information and publications are not meant to be, and do not constitute, financial, investment, trading, or other types of advice or recommendations supplied or endorsed by TradingView. Read more in the Terms of Use.