Hull MA +- ATR by shoxi Added HMA-ATR and HMA+ATR to make easier taking profits and placing stop losses in intraday trading.
Поиск скриптов по запросу "hull+ma通达信源码"

Ichimoku Kinko Hyo + HULL-MA_X + MacDThe Ichimoku Kinko Hyo system includes five kinds of signal, of which this strategy uses the most recent of ones i.e. Tenkan Sen / Kijun Sen Cross and price crosses the Kijun Sen. As the Chikou Span, Senkou Span A and Senkou Span B are shifted into the past/future, the trigger signals will be only be used for visual confirmation and not part of the strategy.
The Tenkan Sen, also known as the Turning or Conversion line, is a moving average of the highest high and lowest low over the last 9 periods in this strategy.
The Kijun Sen, also known as the Standard or Base line, is a moving average of the highest high and lowest low over the last 24 periods in this strategy.
The Chikou Span, also known as the Lagging line, is the closing price plotted 24 periods behind in this strategy.
The Senkou Span A, also known as the 1st leading line, is a moving average of the Tenkan Sen and Kijun Sen and is plotted 24 periods ahead in this strategy.
The Senkou Span B, also known as the 2nd leading line, is a moving average of the highest high and lowest low over the last 51 trading days is plotted 24 periods ahead in this strategy.
Moving average convergence divergence (MaCD) is a trend-following momentum indicator that shows the relationship between two moving averages of prices. The MaCD is calculated in this strategy by subtracting the 24-day exponential moving average (EMA) from the 12-day EMA. A nine-day EMA of the MACD, called the "signal line", aMaCD in this case, is then plotted on top of the MaCD. In this strategy, MaCD/ aMaCD Cross is functioning as a trigger for buy and sell signals.
As with most technical analysis methods, Ichimoku is likely to produce frequent conflicting signals in non-trending markets, So in addition to Ichimoku Kinko Hyo, the Hull MA is popular amongst some day traders, as the indicator which in combination with MaCD attempts to give an accurate signal by eliminating lags and improving the smoothness of the line.
Alan Hull, developed this moving average indicator and hence it’s called the Hull MA.
Now, let’s dissect how the Hull moving average is calculated.
The Hull MA involves the weighted moving average (WMA) in its calculation.
First, calculate the WMA with period (n / 2) and multiply this by 2. Remember ‘n’ is the time period configurable based on the trader’s requirement. The default setting is 12 periods in this strategy, fast Hull MA crossing slow Hull MA will generate a circle on charts.
Second, calculate the WMA for period “n” and subtract if from the first step. Thirdly, calculate the weighted moving average with period sqrt (n) using the data from the second step. You can take a look at the below formula:
Hull MA= WMA (2*WMA (n/2) − WMA (n)), sqrt (n))
The Hull MA Cross in combination with Tenkan Sen / Kijun Sen Cross and MaCD tries to give an accurate signal by eliminating lags and improve the smoothness of price activity. Please note that price trends can and do change often, so your readings of the charts and this trading system should be probabilistic, rather than predictive.

Bollinger Bands With User Selectable MABollinger Bands with user selection options to calculate the moving average basis and bands from a variety of different moving averages.
The user selects their choice of moving average, and the bands automatically adjust. The user may select a MA that reacts faster to volatility or slower/smoother.
Added additional options to color the bands or basis based on the current trend and alternate candle colors for band touches. Options:
REACT SLOW/SMOOTH TO VOLATILITY
simple moving average (Regular Bollinger Bands)
REACT SMOOTH TO VOLATILITY
exponential moving average (EMA Bollinger Bands)
weighted moving average (Weighted MA Bollinger Bands)
exponential hull moving average (Hull Bollinger Bands with better smoothing)
HIGHLY ADJUSTABLE TO VOLATILITY
Arnaud Legoux Moving average (ALMA Bollinger Bands)
Note: 0.85 ALMA default for more smoothing, set offset=1 to turn off smoothing
REACT HARSH TO VOLATILITY
least squares moving average (Least Squares Bollinger Bands)
REACT VERY FAST TO VOLATILITY
hull moving average (Hull Bollinger Bands or Hullinger Bands)
VALUE ADDED: This script is unique in that no other Bollinger Bands indicator offers a user selection for moving average, and some of the options do not exist yet as Bollinger Bands indicators.
Definitions:
Bollinger Bands: A Bollinger Band® is a technical analysis tool defined by a set of trendlines plotted two standard deviations (positively and negatively) away from a simple moving average (SMA) of a security's price, but which can be adjusted to user preferences.
Exponential Bollinger Bands: The most important characteristics of the Exponential Bollinger Bands indicator are: When the market is flat, the bands will stay much closer to prices. When the volatility is high, the bands move away from prices faster.
Hull Bollinger Bands: Bollinger Bands calculated by Hull moving average, rather than simple moving average or ema. The Hull Moving Average (HMA), developed by Alan Hull, is an extremely fast and smooth moving average. In fact, the HMA almost eliminates lag altogether and manages to improve smoothing at the same time.
Exponential Hull Bollinger Bands: Bollinger Bands calculated by Exponential Hull moving average, rather than simple moving average or ema. The Exponential Hull Moving Average is similar to the standard Hull MA, but with superior smoothing. The standard Hull Moving Average is derived from the weighted moving average (WMA). As other moving average built from weighted moving averages it has a tendency to exaggerate price movement.
Weighted Moving Average Bollinger Bands: A Weighted Moving Average (WMA) is similar to the simple moving average (SMA), except the WMA adds significance to more recent data points.
Arnaud Legoux Moving Average Bollinger Bands: ALMA removes small price fluctuations and enhances the trend by applying a moving average twice, once from left to right, and once from right to left. At the end of this process the phase shift (price lag) commonly associated with moving averages is significantly reduced. Zero-phase digital filtering reduces noise in the signal. Conventional filtering reduces noise in the signal, but adds a delay.
Least Squares Bollinger Bands: The indicator is based on sum of least squares method to find a straight line that best fits data for the selected period. The end point of the line is plotted and the process is repeated on each succeeding period.

[blackcat] L3 Hull SeekerOVERVIEW
The L3 Hull Seeker is a comprehensive trading indicator that combines Hull Moving Average (HMA) analysis with robust position management and risk control features. This script is designed to help traders identify potential entry and exit points while maintaining strict risk management protocols.
KEY FEATURES
• Hull MA Analysis:
Advanced Hull Moving Average calculations
Separate Hull MA lines for Close and Open prices
Visual color coding for trend direction
Customizable length parameter for flexibility
• Position Tracking:
Real-time monitoring of long and short positions
Maximum position limit control
Clear position status indicators on chart
• Risk Management System:
User-defined Take Profit percentage
User-defined Stop Loss percentage
Optional activation of TP/SL features
Dynamic label markers for important levels
• Alert System:
Buy/Sell entry alerts
Take Profit/Stop Loss exit alerts
Position status changes
HOW TO USE
Setup Initial Parameters:
Hull MA Length: Adjust based on your trading timeframe
Take Profit Percentage: Set according to your risk tolerance
Stop Loss Percentage: Define your maximum acceptable loss
Enable/Disable Features:
Toggle Take Profit/Stop Loss options as needed
Adjust alert conditions for your trading style
Monitor Trading Signals:
Watch for crossover/crossunder signals
Track position status through labels
Monitor entry and exit alerts
Manage Risk:
Use TP/SL features to control position size
Monitor pyramiding limits
Review position status regularly
TRADE MANAGEMENT
• Entry Conditions:
Long Entry: HullMA_close crosses above HullMA_open
Short Entry: HullMA_close crosses below HullMA_open
• Exit Conditions:
Take Profit: Price reaches defined percentage above/below entry
Stop Loss: Price reaches defined percentage below/above entry
• Position Control:
Limited to one position at a time
Automatic position tracking
Clear visual indication of current trades
TECHNICAL DETAILS
• Hull MA Calculation:
Uses WMA (Weighted Moving Average) for precise calculations
Optimized for trend-following strategies
Smoothed Hull MA lines for better readability
• Label System:
Clear buy/sell markers
Take Profit and Stop Loss indicators
Real-time position status updates
• Alert Configuration:
Customizable alert messages
Multiple alert conditions
Option to enable/disable specific alerts
LIMITATIONS
⚠️ Important Considerations:
Results may vary across different market conditions
Historical performance does not guarantee future results
Always backtest strategy before live trading
Consider complementing with additional analysis tools
BEST PRACTICES
• Recommended Timeframes:
Daily charts for long-term strategies
4-hour charts for swing trading
1-hour charts for short-term trading
• Risk Management Tips:
Start with small position sizes
Always use TP/SL in live trading
Monitor market volatility before entering trades
TROUBLESHOOTING
• Common Issues:
Ensure proper chart resolution
Verify alert conditions are enabled
Check for conflicting indicators
• Performance Optimization:
Use appropriate timeframe for your strategy
Adjust indicator parameters based on market conditions
Monitor for potential overfitting

VB-MainLiteVB-MainLite – v1.0 Initial Release
Overview
VB-MainLite is a consolidated market-structure and execution framework designed to streamline decision-making into a single chart-level view. The script combines multi-timeframe trend, volatility, volume, and liquidity signals into one cohesive visual layer, reducing indicator clutter while preserving depth of information for active traders.
Core Architecture
Trend Backbone – EMA 200
Dedicated EMA 200 acts as the primary trend filter and higher-timeframe bias reference.
Serves as the “spine” of the system for contextualizing all secondary signals (swings, reversals, volume events, etc.).
Custom MA Suite (Envelope Ready)
Four configurable moving averages with flexible source, length, and smoothing.
Default configuration (preset idea: “8/89 Envelope”):
MA #1: EMA 8 on high
MA #2: EMA 8 on low
MA #3: EMA 89 on high
MA #4: EMA 89 on low
All four are disabled by default to keep the chart minimal. Users can toggle them on from the Custom MAs group for envelope or cloud-style configurations.
Nadaraya–Watson Smoother (Swing Framework)
Gaussian-kernel Nadaraya–Watson regression applied to price (hl2) to build a smooth synthetic curve.
Two layers of functionality:
Swing labels (▲ / ▼) at inflection points in the smoothed curve.
Optional curve line that visually tracks the turning structure over the last ~500 bars.
Designed to surface early swing potential before standard MAs react.
Hull Moving Average (Trend Overlay)
Optional Hull MA (HMA) for faster trend visualization.
Color-coded by slope (buy/sell bias).
Default: off to prevent overloading the chart; can be enabled under Hull MA settings.
Momentum, Exhaustion & Pattern Engine
CCI-Based Bar Coloring
CCI applied to close with configurable thresholds.
Overbought / oversold CCI zones map directly into candle coloring to visually highlight short-term momentum extremes.
RSI Top / Bottom Exhaustion Finder
RSI logic applied separately to high-driven (tops) and low-driven (bottoms) sequences.
Plots:
Top arrows where high-side RSI stretches into high-risk territory.
Bottom arrows where low-side RSI indicates exhaustion on the downside.
Useful as confluence around the Nadaraya swing turns and EMA 200 regime.
Engulfing + MA Trend Engine (“Fat Bull / Fat Bear”)
Detects bullish and bearish engulfing patterns, then combines them with MA trend cross logic.
Only when both pattern and MA regime align does the engine flag:
Fat Bull (Engulf + MA aligned long)
Fat Bear (Engulf + MA aligned short)
Candles are marked via conditional barcolor to highlight strong, structured shifts in control.
Fat Finger Detection (Wick Spikes / Stop Runs)
Identifies abnormal wick extensions relative to the prior bar’s body range with configurable tolerance.
Supports detection of potential liquidity grabs, stop runs, or “excess” that may precede reversals or mean-reversion behavior.
Volume & Liquidity Intelligence
Bull Snort (Aggressive Buy Spikes)
Flags events where:
Volume is significantly above the 50-period average, and
Price closes in the upper portion of the bar and above prior close.
Plots a labeled marker below the bar to indicate aggressive upside initiative by buyers.
Pocket Pivots (Accumulation Flags)
Compares current volume vs prior 10 sessions with a filter on prior “up” days.
Highlights pocket pivot days where current green candle volume outclasses recent down-day volumes, suggesting stealth accumulation.
Delta Volume Core (Directional Volume by Price)
Internal volume-by-price style engine over a user-defined lookback.
Splits volume into up-close and down-close buckets across dynamic price bins.
Feeds into S&R and ICT zone logic to quantify where buying vs selling pressure built up.
Structural Context: S&R and ICT Zones
S&R Power Channel
Computes local high/low band over a configurable lookback window.
Renders:
Upper and lower S&R channel lines.
Shaded support / resistance zones using boxes.
Adds Buy Power / Sell Power metrics based on the ratio of up vs down bars inside the window, displayed directly in the zone overlays.
Drops ◈ markers where price interacts dynamically with the top or bottom band, highlighting reaction points.
ICT-Style Premium / Discount & Macro Zones
Two tiered structures:
Local Premium / Discount zones over a shorter SR window.
Macro Premium / Discount zones over a longer macro window.
Each zone:
Uses underlying directional volume to annotate accumulation vs distribution bias.
Provides Delta Volume Bias shading in the mid-band region, visually encoding whether local power flows are net-buying or net-selling.
Enables traders to quickly see whether current trade location is in a local/macro discount or premium context while still respecting volume profile.
Positioning Intelligence: PCD (Stocks)
Position Cost Distribution (PCD) – Stocks Only
Available for stock symbols on intraday up to daily timeframe (≤ 1D).
Uses:
TOTAL_SHARES_OUTSTANDING fundamentals,
Daily OHLCV snapshot, and
A bucketed distribution engine
to approximate cost basis distribution across price.
Outputs:
Horizontal “PCD bars” to the right of current price, density-scaled by estimated share concentration.
Color-coding by profitability relative to current price (profitable vs unprofitable positions).
Labels for:
Current price
Average cost
Profit ratio (share % below current price)
90% cost range
70% cost range
Range overlap as a measure of clustering / concentration.
Multi-Timeframe Trend: Two-Pole Gaussian Dashboard
Two-Pole Gaussian Filter (Line + Cloud)
Smooths a user-selected source (default: close) using a two-pole Gaussian filter with tunable alpha.
Plots:
A thin Gaussian trend line, and
A thick Gaussian “cloud” line with transparency, colored by slope vs past (offsetG).
Functions as a responsive trend backbone that is more sensitive than EMA 200 but less noisy than raw price.
Multi-Timeframe Gaussian Dashboard
Evaluates Gaussian trend direction across up to six timeframes (e.g., 1H / 2H / 4H / Daily / Weekly).
Renders a compact bottom-right table:
Header: symbol + overall bias arrow (up / down) based on average trend alignment.
Row of colored cells per timeframe (green for uptrend, magenta for downtrend) with human-readable TF labels (e.g., “60M”, “4H”, “1D”).
Gives an immediate read on whether intraday, swing, and higher-timeframe flows are aligned or fragmented.
Default Configuration & Usage Guidance
Default state after adding the script:
Enabled by default:
EMA 200 trend backbone
Nadaraya–Watson swing labels and curve
CCI bar coloring
RSI top/bottom arrows
Fat Bull / Fat Bear engine
Bull Snort & Pocket Pivots
S&R Power Channel
ICT Local + Macro zones
Two-pole Gaussian line + cloud + dashboard
PCD engine for stocks (auto-active where data is available)
Disabled by default (opt-in):
Custom MA suite (4x MAs, preset as EMA 8/8/89/89)
Hull MA overlay
How traders can use VB-MainLite in practice:
Use EMA 200 + Gaussian dashboard to define top-down directional bias and avoid trading directly against multi-TF trend.
Use Nadaraya swing labels, RSI exhaustion arrows, and CCI bar colors to time entries within that higher-timeframe bias.
Use Fat Bull / Fat Bear events as structured confirmation that both pattern and MA regime have flipped in the same direction.
Use Bull Snort, Pocket Pivots, and S&R / ICT zones to align execution with liquidity, volume, and location (premium vs discount).
On stocks, use PCD as a positioning map to understand trapped supply, support zones near crowded cost basis, and where profit-taking is likely.

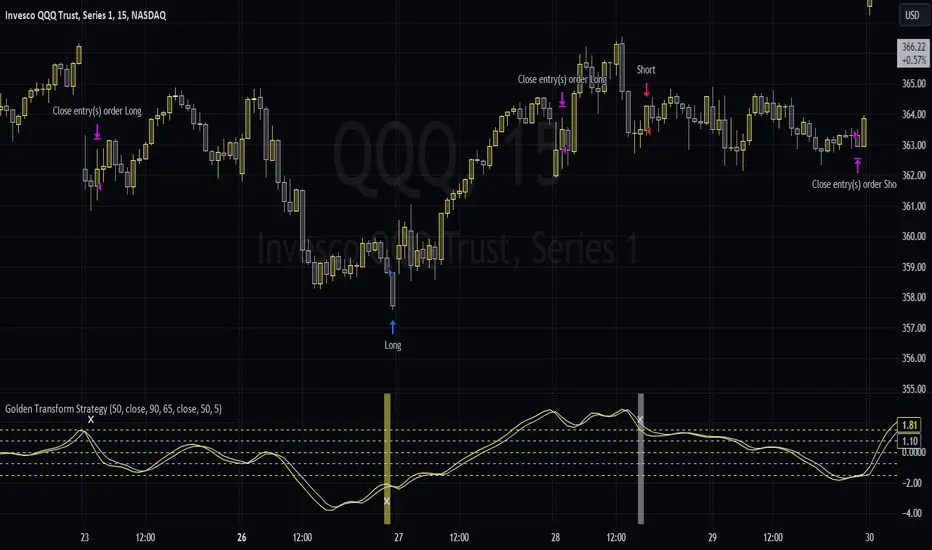
Golden Transform The Golden Transform Oscillator contains multiple technical indicators and conditions for making buy and sell decisions. Here's a breakdown of its components and what it's trying to achieve:
Strategy Setup:
The GT is designed to be plotted on the chart without overlaying other indicators.
Rate of Change (ROC) Calculation:
The Rate of Change (ROC) indicator is calculated with a specified period ("Rate of Change Length").
The ROC measures the percentage change in price over the specified period.
Hull Modified TRIX Calculation:
The Hull Modified TRIX indicator is calculated with a specified period ("Hull TRIX Length").
The Hull MA (Moving Average) formula, a modified WMA, is used to calculate a modified TRIX indicator, which is a momentum oscillator.
Hull MA Calculation:
A Hull Moving Average (Hull MA) is calculated as an entry filter.
Fisher Transform Calculation:
The Fisher Transform indicator is calculated to serve as a preemptive exit filter.
It involves mathematical transformations of price data to create an oscillator that can help identify potential reversals. The Fisher Transform is further smoothed using a Hull Moving Average (HMA).
Conditions and Signals:
Long conditions are determined based on crossovers between ROC and TRIX, as well as price relative the the MA. Short conditions are inversed.
Exit Conditions:
Exit conditions are defined for both long and short positions.
For long positions, the strategy exits if ROC crosses under TRIX, or if the smoothed Fisher Transform crosses above a threshold and declines. Once again, short conditions are the inverse.
Visualization and Plotting:
The script uses background colors for entry and shapes for exits to highlight different levels and conditions for the ROC/TRIX correlation.
It plots the Fisher Transform values and a lag trigger on the chart.
Overall, this script is a complex algorithm that combines multiple technical indicators and conditions to generate trading signals and manage positions in the financial markets. It aims to identify potential entry and exit points based on the interplay of the mentioned indicators and conditions.
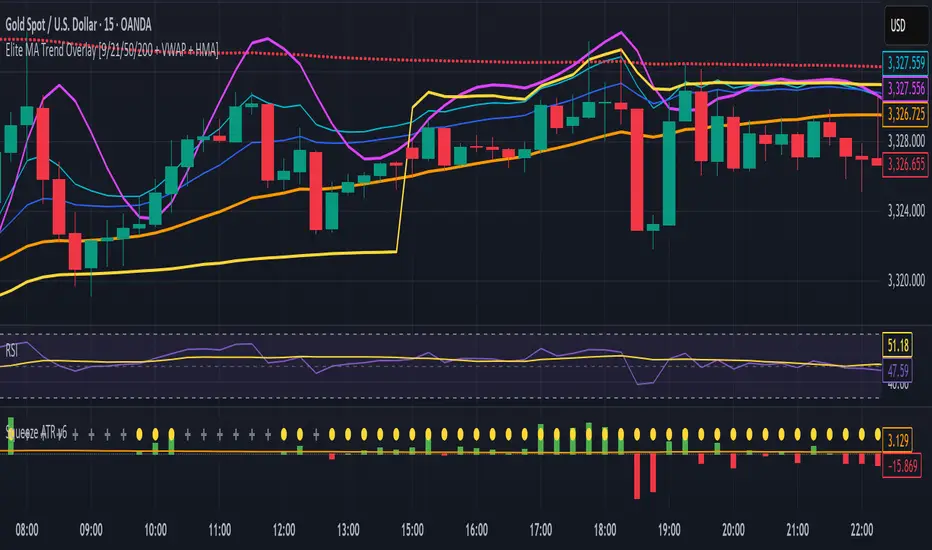
Elite MA Trend Overlay [9/21/50/200 + VWAP + HMA]🔍 What It Is:
The Elite MA Trend Overlay is a professional-grade moving average system built for day traders, scalpers, and swing traders who need clear, visual trend confirmation and precise entry zones across all timeframes.
This overlay combines 5 industry-proven tools into one compact indicator for sniper-level decision making:
EMA 9 – Entry momentum
EMA 21 – Microstructure guide
EMA 50 – Trend bias filter
EMA 200 – Institutional macro direction
VWAP – Intraday fair value (used by pros)
Hull MA (HMA) – Early shift detector
It also features auto-detected trend zones using color-coded background shading to help you instantly know if the market is in a bullish or bearish regime.
🧠 How It Works:
The script dynamically plots the short-term to long-term moving averages to reflect real-time market structure. When all EMAs are aligned in one direction, a colored background highlights the dominant trend:
✅ Green background = Bullish trend (9 > 21 > 50 > 200)
🔻 Red background = Bearish trend (9 < 21 < 50 < 200)
The VWAP line acts as a magnet and decision zone—traders use it for intraday entries or exits. The Hull Moving Average adapts quickly to price shifts, making it perfect for spotting early reversals before the EMAs cross.
🎯 Why It Helps Traders Succeed:
This indicator:
Removes guesswork: Know instantly if you’re in a strong trend or chop zone.
Filters bad trades: Avoid entering against structure or into volatility traps.
Improves timing: Use pullbacks to EMAs or Hull MA flips for sniper entries.
Works across timeframes: From scalping 1-minute to swing trading daily charts.
Whether you're trading gold, forex, stocks, or crypto — this overlay gives you clean, professional structure that keeps you disciplined and sharp.
⚙️ Features:
On/off toggles for VWAP & Hull MA
Minimalist, clutter-free plotting
Auto background color zones
Supports Pine Script v6 (latest version)
👑 Recommended Use:
Confirm trend with background + EMA alignment
Enter on pullbacks to EMA 21 or 50
Use Hull MA or RSI for early reversal detection
Exit at VWAP reversion or trend exhaustion
💬 “Structure is everything. Trade with the flow, not against it.”
Fibonacci Levels on Any Indicator [By MUQWISHI]▋ INTRODUCTION :
A “Fibonacci Levels on Any Indicator” can be applied to any indicator to draw Fibonacci levels based on provided conditions of two price points to produce a sequence of horizontal line levels starting from 0% to 100% in addition to extension levels. The 0% level is measured as the start of retracement, while the 100% level is the beginning of the extension levels. This tool was developed to be easy to add to any indicator, and it could be valuable to some traders in terms of managing trades by setting targets and reducing risk in the trend direction.
_______________________
▋ USAGE:
➤ NEEDS TO IDENTIFY 4 ELEMENTS:
1. Starting Point. What’re the conditions / When will the drawing of the Fibonacci levels begin?
2. Ending Point. What’re the conditions / When will the drawing of the Fibonacci levels end?
3. High Point. What is the price for a 100% Fibonacci level (0% for the downside)?
4. Low Point. What is the price for a 0% Fibonacci level (100% for the downside)?
➤ STARTING & ENDING POINTS CONDITIONS:
Need to specify the condition when the drawing of Fibonacci levels starts and ends, and the indicator shows different prepared conditions.
New Phase: Import a value (plot) from an existing indicator, where its status changes from NaN to a real number.
Crosses Above/Below: Import a value(1) (plot) from an existing indicator, where it crosses above/below value(2).
Reversal Up/Down: Import a value(1) (plot) from an existing indicator, where it rises/decreases than the previous value(1).
First/Last Bar: Useful to draw stationary Fibonacci levels.
➤ UPPER & LOWER PIVOTS (0% & 100%):
Need to specify the two price points representing 0% & 100% Fibonacci levels to expose the sequence of Fibonacci lines.
Upper Pivot. By default, the ATR Upper Band. It’s possible to import a custom value from an existing indicator.
Lower Pivot. By default, the ATR Lower Band. It’s possible to import a custom value from an existing indicator.
➤ FIBONACCI STYLING OPTIONS:
Ability to customize line & label style, color, reverse, and hide/show levels.
_______________________
▋ IMPLEMENTATION:
Here are some examples of implementing the indicator.
Note: All presented examples below are for demonstration purposes, and they're not trading suggestions.
# Example 1: (Reversal Up/Down)
We want to implement Fibonacci levels on the Hull MA by mohamed982 . Our requirements are as follows:
Fibonacci levels start when the Hull MA reverses up.
Fibonacci levels end when the Hull MA reverses down.
Upper Pivot is the ATR Upper Band.
Lower Pivot is the ATR Lower Band.
After adding the required indicator (Hull MA), here’re the implementation and results
# Example 2: (Crosses Above/Below)
We want to implement Fibonacci Level on the Squeeze Momentum by LazyBear . Our requirements are as follows:
Fibonacci levels start when the Squeeze Momentum histogram crosses above 0.
Fibonacci levels end when the Squeeze Momentum histogram crosses below 0.
Upper Pivot is the Bollinger Upper Band.
Lower Pivot is the Bollinger Lower Band.
After adding the required indicators (Squeeze Momentum & Bollinger Band), here’re the implementation and results
# Example 3: (Crosses Above/Below)
We want to implement Fibonacci Level on the Crossing Moving Averages. Our requirements are as follows:
Fibonacci levels start when the 20-EMA crosses above 100-MA.
Fibonacci levels end when the 20-EMA crosses below 100-MA.
Upper Pivot is the ATR Upper Band.
Lower Pivot is the ATR Lower Band.
After adding the required indicators (20-EMA & 100-MA), here’re the implementation and results
# Example 4: (New Phase: When the previous value is NaN, and the current value is a real number.)
We want to implement Fibonacci Level on the Supertrend. Our requirements are as follows:
Fibonacci levels start when an up-Supertrend (green) line shows up.
Fibonacci levels end when a down-Supertrend (red) line shows up.
Upper Pivot is the down-Supertrend.
Lower Pivot is the up-Supertrend.
After adding the required indicator (Supertrend), here’re the implementation and results
# Example 5: (First/Last Bar)
We want to implement Fibonacci Level between two points, 330 & 300. Our requirements are as follows:
Fibonacci levels start at first bar on the chart.
Fibonacci levels end at last bar on the chart.
Upper Pivot is 330.
Lower Pivot is 300.
Here’re the implementation and results.
To customize the number of bars back (like 50 bars)
_______________________
▋ Final Comments:
The “Fibonacci Levels on Any Indicator” is made to apply on other indicators for planning Fibonacci Levels.
It can be implemented in different ways, along with presented examples.
This indicator does not work with plots that were developed by drawing classes.
Please let me know if you have any questions.
Thank you.

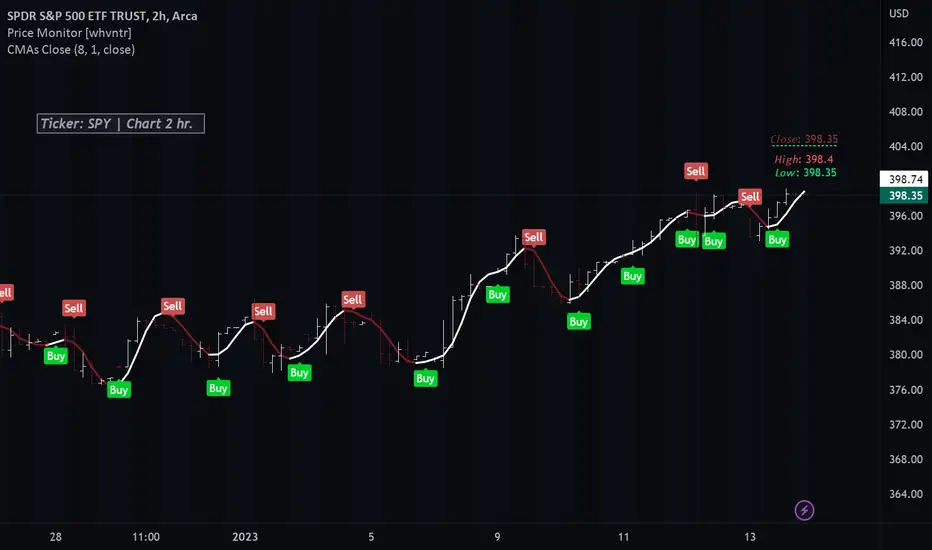
Colored Moving Averages With Close Signals[Whvntr][TradeStation]Plots the first time the close price is above or below the colored portion of the chosen MA. The MA's formula is from TradeStation's indicator: "Colored Moving Averages Can Help You Spot Trends" . I modified that indicator with customizations that include: Buy and Sell signals. Each time the current bar closes above the MA, while it's red (bearish), there's a Sell label at the start of that MA trend. Likewise: each time the current bar closes below the MA, while it's white (bullish), there's a Buy label at the beginning of that MA trend. You can now, also, easily see which MA you are selecting by hovering your cursor over the tooltips icon. I've included a modified Hull MA as default because I've found this SMA combination with the WMA to be a very smooth oscillation. I've also added some different types of MA's. Colored moving averages are helpful to determine when a trend may be reversing.
MA's
1 · Modified Hull MA: (SMA of the WMAs Hull Formula)
2 · Hull MA
3 · Exponential Moving Average
4 · Weighted Moving Average
5 · RMA Moving Average used in RSI
6 · Volume Weighted MA
7 · Simple Moving Average
This indicator isn't endorsed as a guarantee of future, favorable, results.
Keltner Channel With User Selectable Moving AvgKeltner Channel with user options to calculate the moving average basis and envelopes from a variety of different moving averages.
The user selects their choice of moving average, and the envelopes automatically adjust. The user may select a MA that reacts faster to volatility or slower/smoother.
Added additional options to color the envelopes or basis based on the current trend and alternate candle colors for envelope touches. The script has a rainbow gradient by default based on RSI.
Options (generally from slower/smoother to faster/more responsive to volatility):
SMMA,
SMA,
Donchian, (Note: Selecting Donchian will just convert this indicator to a regular Donchian Channel)
Tillson T3,
EMA,
VWMA,
WMA,
EHMA,
ALMA,
LSMA,
HMA,
TEMA
Value Added:
Allows Keltner Channel to be calculated from a variety of moving averages other than EMA/SMA, including ones that are well liked by traders such as Tillson T3, ALMA, Hull MA, and TEMA.
Glossary:
The Hull Moving Average ( HMA ), developed by Alan Hull, is an extremely fast and smooth moving average . In fact, the HMA almost eliminates lag altogether and manages to improve smoothing at the same time.
The Exponential Hull Moving Average is similar to the standard Hull MA, but with superior smoothing. The standard Hull Moving Average is derived from the weighted moving average ( WMA ). As other moving average built from weighted moving averages it has a tendency to exaggerate price movement.
Weighted Moving Average: A Weighted Moving Average ( WMA ) is similar to the simple moving average ( SMA ), except the WMA adds significance to more recent data points.
Arnaud Legoux Moving Average: ALMA removes small price fluctuations and enhances the trend by applying a moving average twice, once from left to right, and once from right to left. At the end of this process the phase shift (price lag) commonly associated with moving averages is significantly reduced. Zero-phase digital filtering reduces noise in the signal. Conventional filtering reduces noise in the signal, but adds a delay.
Least Squares: Based on sum of least squares method to find a straight line that best fits data for the selected period. The end point of the line is plotted and the process is repeated on each succeeding period.
Triple EMA (TEMA) : The triple exponential moving average (TEMA) was designed to smooth price fluctuations, thereby making it easier to identify trends without the lag associated with traditional moving averages (MA). It does this by taking multiple exponential moving averages (EMA) of the original EMA and subtracting out some of the lag.
Running (SMoothed) Moving Average: A Modified Moving Average (MMA) (otherwise known as the Running Moving Average (RMA), or SMoothed Moving Average (SMMA)) is an indicator that shows the average value of a security's price over a period of time. It works very similar to the Exponential Moving Average, they are equivalent but for different periods (e.g., the MMA value for a 14-day period will be the same as EMA-value for a 27-days period).
Volume-Weighted Moving Average: The Volume-weighted Moving Average (VWMA) emphasizes volume by weighing prices based on the amount of trading activity in a given period of time. Users can set the length, the source and an offset. Prices with heavy trading activity get more weight than prices with light trading activity.
Tillson T3: The Tillson moving average a.k.a. the Tillson T3 indicator is one of the smoothest moving averages and is both composite and adaptive.

Big Snapper Alerts R2.0 by JustUncleLThis is a diversified Binary Option or Scalping Alert indicator originally designed for lower Time Frame Trend or Swing trading. Although you will find it a useful tool for higher time frames as well.
The Alerts are generated by the changing direction of the ColouredMA (HullMA by default), you then have the choice of selecting the Directional filtering on these signals or a Bollinger swing reversal filter.
The filters include:
Type 1 - The three MAs (EMAs 21,55,89 by default) in various combinations or by themselves. When only one directional MA selected then direction filter is given by ColouredMA above(up)/below(down) selected MA. If more than one MA selected the direction is given by MAs being in correct order for trend direction.
Type 2 - The SuperTrend direction is used to filter ColouredMA signals.
Type 3 - Bollinger Band Outside In is used to filter ColouredMA for swing reversals.
Type 4 - No directional filtering, all signals from the ColouredMA are shown.
Notes:
Each Type can be combined with another type to form more complex filtration.
Alerts can also be disabled completely if you just want one indicator with one colouredMA and/or 3xMAs and/or Bollinger Bands and/or SuperTrend painted on the chart.
Warning:
Be aware that combining Bollinger OutsideIn swing filter and a directional filter can be counter productive as they are opposites. So careful consideration is needed when combining Bollinger OutsideIn with any of the directional filters.
Hints:
For Binary Options try ColouredMA = HullMA(13) or HullMA(8) with Type 2 or 3 Filter.
When using Trend filters SuperTrend and/or 3xMA Trend, you will find if price reverses and breaks back through the Big Fat Signal line, then this can be a good reversal trade.
Some explanation about the what Hull Moving average and ideas of how the generated in Big Snapper can be used:
tradingsim.com
forextradingstrategies4u.com
Inspiration from @vdubus
Big Snapper's Bollinger OutsideIn Swing filter in Action:

HUll Dynamic BandEducational Hull Moving Average Wave Analysis Tool
**MARS** is an innovative educational indicator that combines multiple Hull Moving Average timeframes to create a comprehensive wave analysis system, similar in concept to Ichimoku Cloud but with enhanced smoothness and responsiveness.
---
🎯 Key Features
**Triple Wave System**
- **Peak Wave (34-period)**: Fast momentum signals, similar to Ichimoku's Conversion Line
- **Primary Wave (89-period)**: Main trend identification with retest detection
- **Swell Wave (178-period)**: Long-term trend context and major wave analysis
**Visual Wave Analysis**
- **Wave Power Fill**: Dynamic area between primary and swell waves showing trend strength
- **Peak Power Fill**: Short-term momentum visualization
- **Smooth Curves**: Hull MA-based calculations provide cleaner signals than traditional moving averages
**Intelligent Signal System**
- **Trend Shift Signals**: Clear visual markers when trend changes occur
- **Retest Detection**: Identifies potential retest opportunities with specific conditions
- **Correction Alerts**: Early warning signals for market corrections
---
📊 How It Works
The indicator uses **Hull Moving Averages** with **Fibonacci-based periods** (34, 89, 178) and a **Golden Ratio multiplier (1.64)** to create natural market rhythm analysis.
**Key Signal Types:**
- 🔵 **Circles**: Major trend shifts (primary wave crossovers)
- 💎 **Diamonds**: Retest opportunities with multi-wave confirmation
- ❌ **X-marks**: Correction signals and structural breaks
- 🌊 **Wave Fills**: Visual trend strength and direction
---
🎓 Educational Purpose
This indicator demonstrates:
- Advanced moving average techniques using Hull MA
- Multi-timeframe analysis in a single view
- Wave theory application in technical analysis
- Dynamic support/resistance concept visualization
**Similar to Ichimoku but Different:**
- Ichimoku uses price-based calculations → Angular cloud shapes
- MARS uses weighted averages → Smooth, flowing wave patterns
- Both identify trend direction, but MARS offers faster signals with cleaner visualization
---
⚙️ Customizable Settings
- **Wave Periods**: Adjust primary wave length (default: 89)
- **Multipliers**: Fine-tune wave sensitivity (default: 1.64 Golden Ratio)
- **Visual Style**: Customize line widths and signal displays
- **Peak Analysis**: Independent fast signal system (default: 34)
---
🔍 Usage Tips
1. **Trend Identification**: Watch wave fill colors and line positions
2. **Entry Timing**: Look for retest diamonds after trend shift circles
3. **Risk Management**: Use wave boundaries as dynamic support/resistance
4. **Confirmation**: Combine with price action and market structure analysis
---
⚠️ Important Notes
- **Educational Tool**: Designed for learning wave analysis concepts
- **Not Financial Advice**: Always use proper risk management
- **Backtesting Recommended**: Test on historical data before live trading
- **Combine with Analysis**: Works best with additional confirmation methods
---
🚀 Innovation
MARS represents a unique approach to wave analysis by:
- Combining Hull MA smoothness with Ichimoku-style visualization
- Providing multi-timeframe analysis without chart clutter
- Offering retest detection with specific wave conditions
- Creating an educational bridge between different analytical methods
---
*This indicator is shared for educational purposes to help traders understand advanced moving average techniques and wave analysis concepts. Always practice proper risk management and combine with your own analysis.*

RSI TrendRSI Hull Trend is a hybrid indicator with RSI of HULL Signal. The Hull MA is combined with RSI to see if the Hull MA Buy/Sell Signal is in overbought or oversold condition. Buy Sell Signals are plotted based on settings of OB/OS or RSI. This indicator is very useful to see if the Trend is in Exhaustion or Beginning of a Trend. Entry and Exit conditions can be more precise based on OB/OS condition of price action. In addition normal RSI trend is plotted with trend color from Hull MA. Best Performance with Heiken Ashi Candles.
OB/OS Settings provided
Hull Buy/Sell Signals plotted
Double RSI FAST and DEFAULT signal with crossover
Bar Color applied based on Hull RSI Trend
Hull Trend + RSI + Price Action

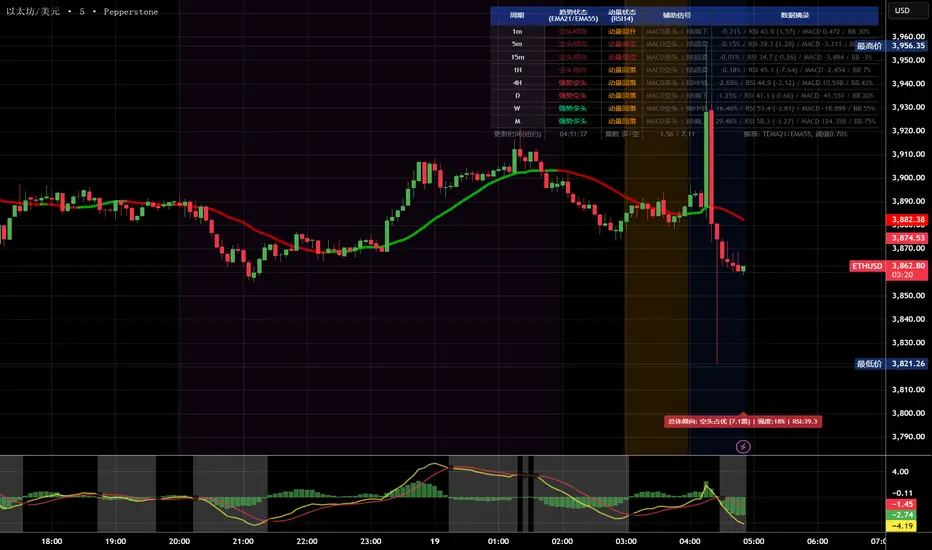
多周期趋势动量面板加强版(Multi-Timeframe Trend Momentum Panel - User Guide)多周期趋势动量面板(Multi-Timeframe Trend Momentum Panel - User Guide)(english explanation follows.)
📖 指标功能详解 (精简版):
🎯 核心功能:
1. 多周期趋势分析 同时监控8个时间周期(1m/5m/15m/1H/4H/D/W/M)
2. 4维度投票系统 MA趋势+RSI动量+MACD+布林带综合判断
3. 全球交易时段 可视化亚洲/伦敦/纽约交易时间
4. 趋势强度评分 0100%量化市场力量
5. 智能警报 强势多空信号自动推送
________________________________________
📚 重要名词解释:
🔵 趋势状态 (MA均线分析):
名词 含义 信号强度
强势多头 快MA远高于慢MA(差值≥0.35%) ⭐⭐⭐⭐⭐ 做多
多头倾向 快MA略高于慢MA(差值<0.35%) ⭐⭐⭐ 谨慎做多
震荡 快慢MA缠绕,无明确方向 ⚠️ 观望
空头倾向 快MA略低于慢MA ⭐⭐⭐ 谨慎做空
强势空头 快MA远低于慢MA ⭐⭐⭐⭐⭐ 做空
简单理解: 快MA就像短跑运动员(反应快),慢MA是长跑运动员(稳定)。短跑远超长跑=强势多头,反之=强势空头。
________________________________________
🟠 动量状态 (RSI力度分析):
名词 含义 操作建议
动量上攻↗ RSI>60且快速上升 强烈买入信号
动量高位 RSI>60但上升变慢 警惕回调,可减仓
动量中性 RSI在4060之间,平稳 等待方向明确
动量低位 RSI<40但下跌变慢 警惕反弹,可止盈
动量下压↘ RSI<40且快速下降 强烈卖出信号
简单理解: RSI就像汽车速度表。"动量上攻"=油门踩到底加速,"动量高位"=已经很快但不再加速了。
________________________________________
🟣 辅助信号:
MACD:
• MACD多头 = 柱状图>0 = 买方力量强
• MACD空头 = 柱状图<0 = 卖方力量强
布林带(BB):
• BB超买 = 价格在布林带上轨附近 = 可能回调
• BB超卖 = 价格在布林带下轨附近 = 可能反弹
• BB中轨 = 价格在中间位置 = 平衡状态
________________________________________
💡 快速上手 3步看懂面板:
第1步: 看"综合结论标签" (K线上方)
• 绿色"多头占优" → 可以做多
• 红色"空头占优" → 可以做空
• 橙色"震荡/均衡" → 观望
第2步: 看"票数 多/空" (面板最下方)
• 多头票数远大于空头 (差距>2) → 趋势强
• 票数接近 (差距<1) → 震荡市
第3步: 看"趋势强度" (综合标签中)
• 强度>70% → 强势趋势,可重仓
• 强度5070% → 中等趋势,正常仓位
• 强度<50% → 弱势,轻仓或观望
________________________________________
🎨 时段背景色含义:
• 紫色背景 = 亚洲时段 (东京交易时间) 波动较小
• 橙色背景 = 伦敦时段 (欧洲交易时间) 波动增大
• 蓝色背景 = 纽约凌晨 美盘准备阶段
• 红色背景 = 纽约关键5分钟 (09:3009:35) ⚠️ 最重要! 市场最活跃,趋势易形成
• 绿色背景 = 纽约上午后段 延续早盘趋势
交易建议: 重点关注红色关键时段,这5分钟往往决定全天方向!
________________________________________
⚙️ 三大市场推荐设置
🥇 黄金: Hull MA 12/EMA 34, 阈值0.250.35%
₿ 比特币: EMA 21/EMA 55, 阈值0.801.20%
💎 以太坊: TEMA 21/EMA 55, 阈值0.600.80%
参数优化建议
黄金 (XAUUSD)
快速MA: Hull MA 12 (超灵敏捕捉黄金快速波动)
慢速MA: EMA 34 (斐波那契数列)
RSI周期: 9 (加快反应)
强趋势阈值: 0.25%
周期: 5, 15, 60, 240, 1440
比特币 (BTCUSD)
快速MA: EMA 21
慢速MA: EMA 55
RSI周期: 14
强趋势阈值: 0.8% (波动大,阈值需提高)
周期: 15, 60, 240, D, W
外汇 EUR/USD
快速MA: TEMA 10 (快速响应)
慢速MA: T3 30, 因子0.7 (平滑噪音)
RSI周期: 14
强趋势阈值: 0.08% (外汇波动小)
周期: 5, 15, 60, 240, 1440
📖 Indicator Function Details (Concise Version):
🎯 Core Functions:
1. MultiTimeframe Trend Analysis Monitors 8 timeframes simultaneously (1m/5m/15m/1H/4H/D/W/M)
2. 4Dimensional Voting System Comprehensive judgment based on MA trend + RSI momentum + MACD + Bollinger Bands
3. Global Trading Sessions Visualizes Asia/London/New York trading hours
4. Trend Strength Score Quantifies market strength from 0100%
5. Smart Alerts Automatically pushes strong bullish/bearish signals
📚 Key Term Explanations:
🔵 Trend Status (MA Analysis):
| Term | Meaning | Signal Strength |
| | | |
| Strong Bull | Fast MA significantly > Slow MA (Diff ≥0.35%) | ⭐⭐⭐⭐⭐ Long |
| Bullish Bias | Fast MA slightly > Slow MA (Diff <0.35%) | ⭐⭐⭐ Caution Long |
| Ranging | MAs intertwined, no clear direction | ⚠️ Wait & See |
| Bearish Bias | Fast MA slightly < Slow MA | ⭐⭐⭐ Caution Short |
| Strong Bear | Fast MA significantly < Slow MA | ⭐⭐⭐⭐⭐ Short |
Simple Understanding: Fast MA = sprinter (fast reaction), Slow MA = longdistance runner (stable). Sprinter far ahead = Strong Bull, opposite = Strong Bear.
🟠 Momentum Status (RSI Analysis):
| Term | Meaning | Trading Suggestion |
| | | |
| Momentum Up ↗ | RSI >60 & rising rapidly | Strong Buy Signal |
| Momentum High | RSI >60 but rising slower | Watch for pullback, consider reducing position |
| Momentum Neutral | RSI between 4060, stable | Wait for clearer direction |
| Momentum Low | RSI <40 but falling slower | Watch for rebound, consider taking profit |
| Momentum Down ↘ | RSI <40 & falling rapidly | Strong Sell Signal |
Simple Understanding: RSI = car speedometer. "Momentum Up" = full throttle acceleration, "Momentum High" = already fast but not accelerating further.
🟣 Auxiliary Signals:
MACD:
MACD Bullish = Histogram >0 = Strong buyer power
MACD Bearish = Histogram <0 = Strong seller power
Bollinger Bands (BB):
BB Overbought = Price near upper band = Possible pullback
BB Oversold = Price near lower band = Possible rebound
BB Middle = Price near middle band = Balanced state
💡 Quick Start 3 Steps to Understand the Panel:
Step 1: Check "Composite Conclusion Label" (Above the chart)
Green "Bulls Favored" → Consider Long
Red "Bears Favored" → Consider Short
Orange "Ranging/Balanced" → Wait & See
Step 2: Check "Votes Bull/Bear" (Bottom of the panel)
Bull votes significantly > Bear votes (Difference >2) → Strong Trend
Votes close (Difference <1) → Ranging Market
Step 3: Check "Trend Strength" (In the composite label)
Strength >70% → Strong Trend, consider heavier position
Strength 5070% → Moderate Trend, normal position size
Strength <50% → Weak Trend, light position or wait & see
🎨 Trading Session Background Color Meanings:
Purple = Asian Session (Tokyo hours) Lower volatility
Orange = London Session (European hours) Increased volatility
Blue = NY Early Morning US session preparation phase
Red = NY Critical 5 Minutes (09:3009:35) ⚠️ Most Important! Market most active, trends easily form
Green = NY Late Morning Continuation of early session trend
Trading Tip: Focus on the red critical period; these 5 minutes often determine the day's direction!
⚙️ Recommended Settings for Three Major Markets
🥇 Gold (XAUUSD):
Fast MA: Hull MA 12 (Highly sensitive for gold's fast moves)
Slow MA: EMA 34 (Fibonacci number)
RSI Period: 9 (Faster reaction)
Strong Trend Threshold: 0.25%
Timeframes: 5, 15, 60, 240, 1440
₿ Bitcoin (BTCUSD):
Fast MA: EMA 21
Slow MA: EMA 55
RSI Period: 14
Strong Trend Threshold: 0.8% (High volatility, requires higher threshold)
Timeframes: 15, 60, 240, D, W
💎 Ethereum (ETHUSD):
Fast MA: TEMA 21
Slow MA: EMA 55
RSI Period: 14
Strong Trend Threshold: 0.600.80%
Timeframes: 15, 60, 240, D, W
💱 Forex EUR/USD:
Fast MA: TEMA 10 (Fast response)
Slow MA: T3 30, Factor 0.7 (Smooths noise)
RSI Period: 14
Strong Trend Threshold: 0.08% (Forex has low volatility)
Timeframes: 5, 15, 60, 240, 1440
多周期趋势动量面板(Multi-Timeframe Trend Momentum Panel - User Guide)多周期趋势动量面板(Multi-Timeframe Trend Momentum Panel - User Guide)(english explanation follows.)
📖 指标功能详解 (精简版):
🎯 核心功能:
1. 多周期趋势分析 同时监控8个时间周期(1m/5m/15m/1H/4H/D/W/M)
2. 4维度投票系统 MA趋势+RSI动量+MACD+布林带综合判断
3. 全球交易时段 可视化亚洲/伦敦/纽约交易时间
4. 趋势强度评分 0100%量化市场力量
5. 智能警报 强势多空信号自动推送
________________________________________
📚 重要名词解释:
🔵 趋势状态 (MA均线分析):
名词 含义 信号强度
强势多头 快MA远高于慢MA(差值≥0.35%) ⭐⭐⭐⭐⭐ 做多
多头倾向 快MA略高于慢MA(差值<0.35%) ⭐⭐⭐ 谨慎做多
震荡 快慢MA缠绕,无明确方向 ⚠️ 观望
空头倾向 快MA略低于慢MA ⭐⭐⭐ 谨慎做空
强势空头 快MA远低于慢MA ⭐⭐⭐⭐⭐ 做空
简单理解: 快MA就像短跑运动员(反应快),慢MA是长跑运动员(稳定)。短跑远超长跑=强势多头,反之=强势空头。
________________________________________
🟠 动量状态 (RSI力度分析):
名词 含义 操作建议
动量上攻↗ RSI>60且快速上升 强烈买入信号
动量高位 RSI>60但上升变慢 警惕回调,可减仓
动量中性 RSI在4060之间,平稳 等待方向明确
动量低位 RSI<40但下跌变慢 警惕反弹,可止盈
动量下压↘ RSI<40且快速下降 强烈卖出信号
简单理解: RSI就像汽车速度表。"动量上攻"=油门踩到底加速,"动量高位"=已经很快但不再加速了。
________________________________________
🟣 辅助信号:
MACD:
• MACD多头 = 柱状图>0 = 买方力量强
• MACD空头 = 柱状图<0 = 卖方力量强
布林带(BB):
• BB超买 = 价格在布林带上轨附近 = 可能回调
• BB超卖 = 价格在布林带下轨附近 = 可能反弹
• BB中轨 = 价格在中间位置 = 平衡状态
________________________________________
💡 快速上手 3步看懂面板:
第1步: 看"综合结论标签" (K线上方)
• 绿色"多头占优" → 可以做多
• 红色"空头占优" → 可以做空
• 橙色"震荡/均衡" → 观望
第2步: 看"票数 多/空" (面板最下方)
• 多头票数远大于空头 (差距>2) → 趋势强
• 票数接近 (差距<1) → 震荡市
第3步: 看"趋势强度" (综合标签中)
• 强度>70% → 强势趋势,可重仓
• 强度5070% → 中等趋势,正常仓位
• 强度<50% → 弱势,轻仓或观望
________________________________________
🎨 时段背景色含义:
• 紫色背景 = 亚洲时段 (东京交易时间) 波动较小
• 橙色背景 = 伦敦时段 (欧洲交易时间) 波动增大
• 蓝色背景 = 纽约凌晨 美盘准备阶段
• 红色背景 = 纽约关键5分钟 (09:3009:35) ⚠️ 最重要! 市场最活跃,趋势易形成
• 绿色背景 = 纽约上午后段 延续早盘趋势
交易建议: 重点关注红色关键时段,这5分钟往往决定全天方向!
________________________________________
⚙️ 三大市场推荐设置
🥇 黄金: Hull MA 12/EMA 34, 阈值0.250.35%
₿ 比特币: EMA 21/EMA 55, 阈值0.801.20%
💎 以太坊: TEMA 21/EMA 55, 阈值0.600.80%
参数优化建议
黄金 (XAUUSD)
快速MA: Hull MA 12 (超灵敏捕捉黄金快速波动)
慢速MA: EMA 34 (斐波那契数列)
RSI周期: 9 (加快反应)
强趋势阈值: 0.25%
周期: 5, 15, 60, 240, 1440
比特币 (BTCUSD)
快速MA: EMA 21
慢速MA: EMA 55
RSI周期: 14
强趋势阈值: 0.8% (波动大,阈值需提高)
周期: 15, 60, 240, D, W
外汇 EUR/USD
快速MA: TEMA 10 (快速响应)
慢速MA: T3 30, 因子0.7 (平滑噪音)
RSI周期: 14
强趋势阈值: 0.08% (外汇波动小)
周期: 5, 15, 60, 240, 1440
📖 Indicator Function Details (Concise Version):
🎯 Core Functions:
1. MultiTimeframe Trend Analysis Monitors 8 timeframes simultaneously (1m/5m/15m/1H/4H/D/W/M)
2. 4Dimensional Voting System Comprehensive judgment based on MA trend + RSI momentum + MACD + Bollinger Bands
3. Global Trading Sessions Visualizes Asia/London/New York trading hours
4. Trend Strength Score Quantifies market strength from 0100%
5. Smart Alerts Automatically pushes strong bullish/bearish signals
📚 Key Term Explanations:
🔵 Trend Status (MA Analysis):
| Term | Meaning | Signal Strength |
| | | |
| Strong Bull | Fast MA significantly > Slow MA (Diff ≥0.35%) | ⭐⭐⭐⭐⭐ Long |
| Bullish Bias | Fast MA slightly > Slow MA (Diff <0.35%) | ⭐⭐⭐ Caution Long |
| Ranging | MAs intertwined, no clear direction | ⚠️ Wait & See |
| Bearish Bias | Fast MA slightly < Slow MA | ⭐⭐⭐ Caution Short |
| Strong Bear | Fast MA significantly < Slow MA | ⭐⭐⭐⭐⭐ Short |
Simple Understanding: Fast MA = sprinter (fast reaction), Slow MA = longdistance runner (stable). Sprinter far ahead = Strong Bull, opposite = Strong Bear.
🟠 Momentum Status (RSI Analysis):
| Term | Meaning | Trading Suggestion |
| | | |
| Momentum Up ↗ | RSI >60 & rising rapidly | Strong Buy Signal |
| Momentum High | RSI >60 but rising slower | Watch for pullback, consider reducing position |
| Momentum Neutral | RSI between 4060, stable | Wait for clearer direction |
| Momentum Low | RSI <40 but falling slower | Watch for rebound, consider taking profit |
| Momentum Down ↘ | RSI <40 & falling rapidly | Strong Sell Signal |
Simple Understanding: RSI = car speedometer. "Momentum Up" = full throttle acceleration, "Momentum High" = already fast but not accelerating further.
🟣 Auxiliary Signals:
MACD:
MACD Bullish = Histogram >0 = Strong buyer power
MACD Bearish = Histogram <0 = Strong seller power
Bollinger Bands (BB):
BB Overbought = Price near upper band = Possible pullback
BB Oversold = Price near lower band = Possible rebound
BB Middle = Price near middle band = Balanced state
💡 Quick Start 3 Steps to Understand the Panel:
Step 1: Check "Composite Conclusion Label" (Above the chart)
Green "Bulls Favored" → Consider Long
Red "Bears Favored" → Consider Short
Orange "Ranging/Balanced" → Wait & See
Step 2: Check "Votes Bull/Bear" (Bottom of the panel)
Bull votes significantly > Bear votes (Difference >2) → Strong Trend
Votes close (Difference <1) → Ranging Market
Step 3: Check "Trend Strength" (In the composite label)
Strength >70% → Strong Trend, consider heavier position
Strength 5070% → Moderate Trend, normal position size
Strength <50% → Weak Trend, light position or wait & see
🎨 Trading Session Background Color Meanings:
Purple = Asian Session (Tokyo hours) Lower volatility
Orange = London Session (European hours) Increased volatility
Blue = NY Early Morning US session preparation phase
Red = NY Critical 5 Minutes (09:3009:35) ⚠️ Most Important! Market most active, trends easily form
Green = NY Late Morning Continuation of early session trend
Trading Tip: Focus on the red critical period; these 5 minutes often determine the day's direction!
⚙️ Recommended Settings for Three Major Markets
🥇 Gold (XAUUSD):
Fast MA: Hull MA 12 (Highly sensitive for gold's fast moves)
Slow MA: EMA 34 (Fibonacci number)
RSI Period: 9 (Faster reaction)
Strong Trend Threshold: 0.25%
Timeframes: 5, 15, 60, 240, 1440
₿ Bitcoin (BTCUSD):
Fast MA: EMA 21
Slow MA: EMA 55
RSI Period: 14
Strong Trend Threshold: 0.8% (High volatility, requires higher threshold)
Timeframes: 15, 60, 240, D, W
💎 Ethereum (ETHUSD):
Fast MA: TEMA 21
Slow MA: EMA 55
RSI Period: 14
Strong Trend Threshold: 0.600.80%
Timeframes: 15, 60, 240, D, W
💱 Forex EUR/USD:
Fast MA: TEMA 10 (Fast response)
Slow MA: T3 30, Factor 0.7 (Smooths noise)
RSI Period: 14
Strong Trend Threshold: 0.08% (Forex has low volatility)
Timeframes: 5, 15, 60, 240, 1440

Hull For LoopHull For Loop is a sophisticated trend-following indicator that combines the smoothness of Hull Moving Averages with advanced trend detection algorithms and robust confirmation mechanisms.
## How It Works
At its foundation, Hull For Loop employs a custom-calculated Hull Moving Average using weighted moving average for-loops to achieve optimal smoothness and responsiveness. The system operates through three distinct layers: Hull MA calculation with adjustable smoothing multipliers, advanced trend detection using ATR-based slope thresholds, and multi-bar trend confirmation to filter false breakouts.
The logic flow is elegantly simple yet powerful:
- Hull Calculation combines half-period and full-period weighted moving averages, then applies square-root smoothing for enhanced responsiveness
- Trend Detection analyzes Hull slope against dynamic ATR-based thresholds, classifying market direction as bullish, bearish, or neutral
- Confirmation System requires sustained directional movement across multiple bars before triggering signals, dramatically reducing whipsaws
When Hull slope exceeds the positive threshold, bullish conditions emerge. When it falls below the negative threshold, bearish momentum takes control. The multi-bar confirmation ensures only sustained moves generate actionable signals, making this system ideal for trend-following strategies across volatile markets.
The advanced slope analysis mechanism adapts to market volatility through ATR integration, ensuring sensitivity remains optimal during both high-volatility breakouts and low-volatility consolidations, delivering consistent performance across varying market conditions.
## Features
- Custom Hull Implementation : For-loop calculations for precise weighted moving average control and enhanced smoothness
- Dynamic Trend Detection : ATR-based slope analysis automatically adjusts sensitivity to market volatility conditions
- Multi-Bar Confirmation : Configurable confirmation periods (1-5 bars) eliminate false signals and reduce trading noise
- Advanced Visual System : Dynamic color coding, optional arrows, and statistics table for comprehensive market visualization
- Optimized for Bitcoin : Extensively backtested parameters delivering 128.58% returns with 55% drawdown reduction versus buy-and-hold
- Flexible Configuration : Hull length (1-200), smoothing multiplier (0.1-3.0), sensitivity (1-10), and confirmation settings
- Professional Alerts : Comprehensive alert system for trend changes and entry signals with strength percentages
- Real-time Analytics : Optional statistics table displaying trend direction, strength, Hull value, and current price
## Signal Generation
Hull For Loop generates multiple signal types for comprehensive trend analysis and precise entry/exit timing:
Primary Signals : Confirmed trend changes from bullish to bearish or vice versa - highest probability directional moves
Entry Signals : Initial trend confirmation after multi-bar validation - optimal position entry points
Strength Indicators : Real-time trend strength percentages based on directional momentum over lookback periods
Visual Confirmations : Color-coded Hull line providing instant visual trend status
The confirmation system adds crucial reliability - signals must persist through the specified confirmation period before activation, ensuring only sustained moves trigger trading decisions rather than temporary price fluctuations.
## Visual Implementation
The indicator employs sophisticated visual elements for immediate trend comprehension and professional chart presentation:
- Dynamic Hull Line : Color-changing line (green/red/gray) with configurable width reflecting current trend status
- Optional Directional Arrows : Triangle markers below/above bars marking confirmed trend changes and entry points (disabled by default)
- Statistics Panel : Optional real-time table showing trend direction, strength percentage, Hull value, and current price
- Professional Color Scheme : Customizable bullish (green), bearish (red), and neutral (gray) color system
## Alerts
Hull For Loop includes comprehensive alert conditions for automated trading integration:
- Hull Trend Change - Confirmed trend direction shift with strength percentage
- Hull BUY Signal - Bullish trend confirmation with price and strength data
- Hull SELL Signal - Bearish trend confirmation with price and strength data
- Alert Frequency - Once per bar to prevent spam while maintaining accuracy
All alerts include contextual information: trend direction, current price, and trend strength percentage for informed decision-making.
## Use Cases
Trend Following : Optimized for sustained directional moves with superior drawdown protection compared to buy-and-hold strategies
Swing Trading : Multi-bar confirmation eliminates false breakouts while capturing significant trend changes
Position Trading : Smooth Hull calculation provides stable signals for longer-term directional positioning
Risk Management : Advanced confirmation system dramatically reduces whipsaw trades and false signals
Crypto Trading : Specifically optimized for Bitcoin with parameters delivering exceptional historical performance
The system demonstrates exceptional performance across volatile assets.

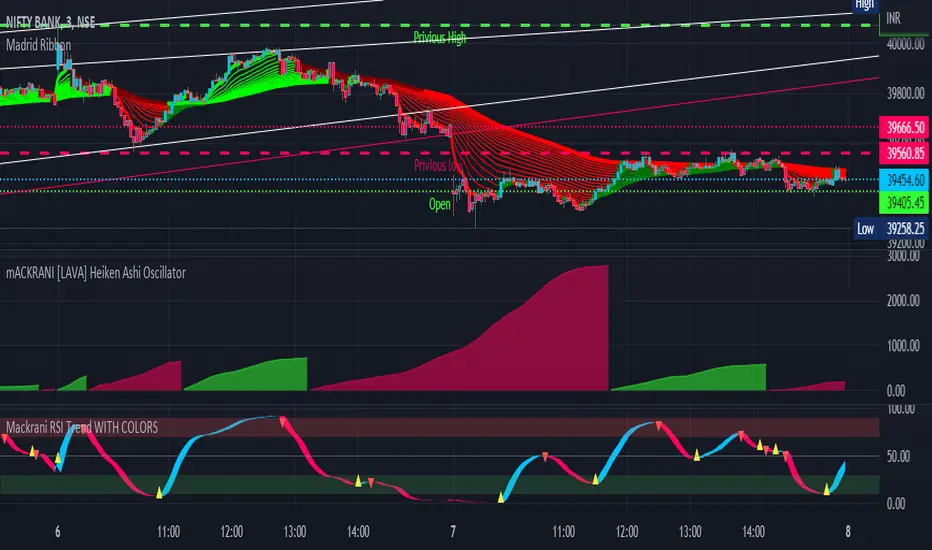
Mackrani RSI Trend WITH COLORSMACKRANI RSI WITH COLORS
Hull Trend is a hybrid indicator with RSI of HULL Signal. The Hull MA is combined with RSI to see if the Hull MA Buy/Sell Signal is in overbought or oversold condition. Buy Sell Signals are plotted based on settings of OB/OS or RSI .
This indicator is very useful to see if the Trend is in Exhaustion or Beginning of a Trend. Entry and Exit conditions can be more precise based on OB/OS condition of price action. In addition normal RSI trend is plotted with trend color from Hull MA. Best Performance with Heiken Ashi Candle
:- OB/OS Settings provided
:- Hull Buy/Sell Signals plotted
:- Double RSI FAST and DEFAULT signal with crossover
:- Bar Color applied based on Hull RSI Trend
:- Hull Trend + RSI + Price Action
Keltner Hull Suite [QuantAlgo]🟢 Overview
The Keltner Hull Suite combines Hull Moving Average positioning with double-smoothed True Range banding to identify trend regimes and filter market noise. The indicator establishes upper and lower volatility bounds around the Hull MA, with the trend line conditionally updating only when price violates these boundaries. This mechanism distinguishes between genuine directional shifts and temporary price fluctuations, providing traders and investors with a systematic framework for trend identification that adapts to changing volatility conditions across multiple timeframes and asset classes.
🟢 How It Works
The calculation foundation begins with the Hull Moving Average, a weighted moving average designed to minimize lag while maintaining smoothness:
hullMA = ta.hma(priceSource, hullPeriod)
The indicator then calculates true range and applies dual exponential smoothing to create a volatility measure that responds more quickly to volatility changes than traditional ATR implementations while maintaining stability through the double-smoothing process:
tr = ta.tr(true)
smoothTR = ta.ema(tr, keltnerPeriod)
doubleSmooth = ta.ema(smoothTR, keltnerPeriod)
deviation = doubleSmooth * keltnerMultiplier
Dynamic support and resistance boundaries are constructed by applying the multiplier-scaled volatility deviation to the Hull MA, creating upper and lower bounds that expand during volatile periods and contract during consolidation:
upperBound = hullMA + deviation
lowerBound = hullMA - deviation
The trend line employs a conditional update mechanism that prevents premature trend reversals. The system maintains the current trend line until price action violates the respective boundary, at which point the trend line snaps to the violated bound:
if upperBound < trendLine
trendLine := upperBound
if lowerBound > trendLine
trendLine := lowerBound
Directional bias determination compares the current trend line value against its previous value, establishing bullish conditions when rising and bearish conditions when falling. Signal generation occurs on state transitions, triggering alerts when the trend state shifts from neutral or opposite direction:
trendUp = trendLine > trendLine
trendDown = trendLine < trendLine
longSignal = trendState == 1 and trendState != 1
shortSignal = trendState == -1 and trendState != -1
The visualization layer creates a trend band by plotting both the current trend line and a two-bar shifted version, with the area between them filled to create a visual channel that reinforces directional conviction.
🟢 How to Use This Indicator
▶ Long and Short Signals: The indicator generates long/buy signals when the trend state transitions to bullish (trend line begins rising) and short/sell signals when transitioning to bearish (trend line begins falling). These state changes represent structural shifts in momentum where price has broken through the adaptive volatility bands, confirming directional commitment.
▶ Trend Band Dynamics: The spacing between the main trend line and its shifted counterpart creates a visual band whose width reflects trend strength and momentum consistency. Expanding bands indicate accelerating directional movement and strong trend persistence, while contracting or flattening bands suggest decelerating momentum, potential trend exhaustion, or impending consolidation. Monitoring band width provides early warning of regime transitions from trending to range-bound conditions.
▶ Preconfigured Presets: Three optimized parameter sets accommodate different trading styles and timeframes. Default (14, 20, 2.0) provides balanced trend identification suitable for daily charts and swing trading, Fast Response (10, 14, 1.5) delivers aggressive signal generation optimized for intraday scalping and momentum trading on 1-15 minute timeframes, while Smooth Trend (18, 30, 2.5) offers conservative trend confirmation ideal for position trading on 4-hour to daily charts with enhanced noise filtration.
▶ Built-in Alerts: Three alert conditions enable automated monitoring - Bullish Trend Signal triggers on long setup confirmation, Bearish Trend Signal activates on short setup confirmation, and Trend Change alerts on any directional transition. These notifications allow you to respond to regime shifts without continuous chart monitoring.
▶ Color Customization: Five visual themes (Classic, Aqua, Cosmic, Ember, Neon, plus Custom) accommodate different chart backgrounds and display preferences, ensuring optimal contrast and visual clarity across trading environments.

Deadzone Pro @DaviddTechDeadzone Pro by @DaviddTech – Adaptive Multi-Strategy NNFX Trading System
Deadzone Pro by @DaviddTech is a meticulously engineered trading indicator that strictly adheres to the No-Nonsense Forex (NNFX) methodology. It integrates adaptive trend detection, dual confirmation indicators, advanced volatility filtering, and dynamic risk management into one powerful, visually intuitive system. Ideal for traders seeking precision and clarity, this indicator consistently delivers high-probability trade setups across all market conditions.
🔥 Key Features:
The Setup:
Adaptive Hull Moving Average Baseline: Clearly identifies trend direction using an advanced, gradient-colored Hull MA that intensifies based on trend strength, providing immediate visual clarity.
Dual Confirmation Indicators: Combines Waddah Attar Explosion (momentum detector) and Bull/Bear Power (strength gauge) for robust validation, significantly reducing false entries.
Volatility Filter (ADX): Ensures entries are only made during strong trending markets, filtering out weak, range-bound scenarios for enhanced trade accuracy.
Dynamic Trailing Stop Loss: Implements a SuperTrend-based trailing stop using adaptive ATR calculations, managing risk effectively while optimizing exits.
Dashboard:
💎 Gradient Visualization & User Interface:
Dynamic gradient colors enhance readability, clearly indicating bullish/bearish strength.
Comprehensive dashboard summarizes component statuses, real-time market sentiment, and entry conditions at a glance.
Distinct and clear buy/sell entry and exit signals, with adaptive stop-loss levels visually plotted.
Candlestick coloring based on momentum signals (Waddah Attar) for intuitive market reading.
📈 How to Interpret Signals:
Bullish Signal: Enter when Hull MA baseline trends upward, both confirmation indicators align bullish, ADX indicates strong trend (>25), and price breaks above the previous trailing stop.
Bearish Signal: Enter short or exit long when Hull MA baseline trends downward, confirmations indicate bearish momentum, ADX confirms trend strength, and price breaks below previous trailing stop.
📊 Recommended Usage:
Timeframes: Ideal on 1H, 4H, and Daily charts for swing trading; effective on shorter (5M, 15M) charts for day trading.
Markets: Compatible with Forex, Crypto, Indices, Stocks, and Commodities.
The Entry & Exit:
🎯 Trading Styles:
Choose from three distinct trading modes:
Conservative: Requires full alignment of all indicators for maximum accuracy.
Balanced (Default): Optimized balance between signal frequency and reliability.
Aggressive: Fewer confirmations needed for more frequent trading signals.
📝 Credits & Originality:
Deadzone Pro incorporates advanced concepts inspired by:
Hull Moving Average by @Julien_Eche
Waddah Attar Explosion by @LazyBear
Bull Bear Power by @Pinecoders
ADX methodology by @BeikabuOyaji
This system has been significantly refactored and enhanced by @DaviddTech to maximize synergy, clarity, and usability, standing apart distinctly from its original components.
Deadzone Pro exemplifies precision and discipline, aligning fully with NNFX principles to provide traders with a comprehensive yet intuitive trading advantage.

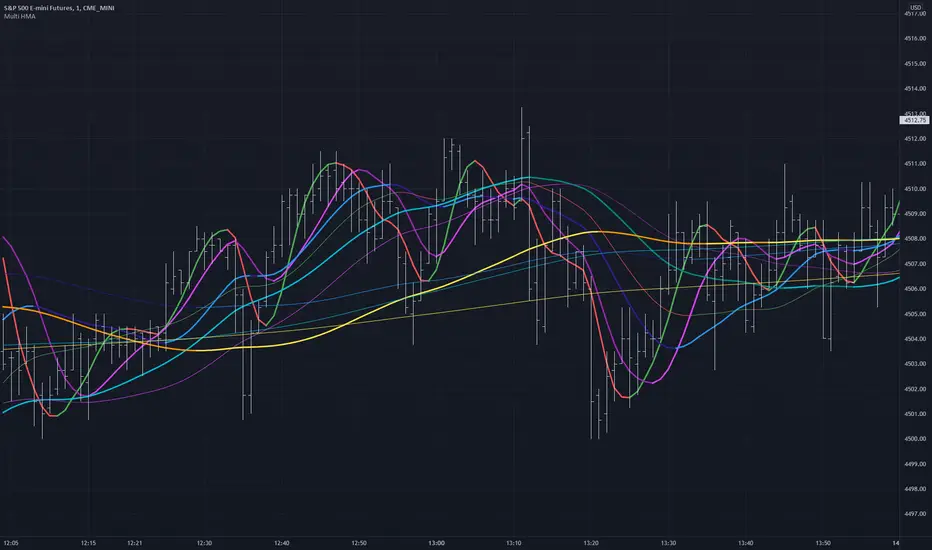
Multiple HMA Original Indicator Script for calculation and color change Hull Ma written and published by huyfibo
I found his version preferable and superior due to the method of mathematics used to get the Hull Ma
I have duplicated huyfibo's calculation for 1 line multiple times, changed variables on each one to create 12 total lines, and customized the color and width of each to help them be identifiable on the 1 minute chart.
This indicator was requested and written for a study to replace multiple SMA's with Hull MAs to compare accuracy as the Hull has much less lag.
As you can see on the above chart, it displays both the 200(1 min) and 1000 ( 5 min) HMA in gold . If user was watching the 1 min chart expecting price to resist at the 200, it would not hold. Although on the 5 min chart it does. This combination gives the user the expectation that price could jump the first line and resist at the second, which it does here.
Combining multiple lines into 1 also to take up much less room at the top of the chart for cleaner visual.
Default values are as such so that the user can have 5 min values displayed on a 1 min chart, as well as the equiv of 200 on the 30 min chart for the 2 and 4 hour.
This is a simply a matter of convenience for the study and can be unchecked to be hidden.
Coded colors and lengths are to visually discern comparable values. Both 1 and 5 min timeframes are the same color, but 1 min timeframe value has larger linewidth
Hull # 10 and 11 are intended for 30 min timeframe and should be unchecked for anything less as their value with be invalid.
All period values, color combinations, and line width can be changed in the the input menu.
TrendTwisterV1.5 (Forex Ready + Indicators)A Precision Trend-Following TradingView Strategy for Forex**
HullShiftFX is a Pine Script strategy for TradingView that combines the power of the **Hull Moving Average (HMA)** and a **shifted Exponential Moving Average (EMA)** with multi-layered momentum filters including **RSI** and **dual Stochastic Oscillators**.
It’s designed for traders looking to catch high-probability breakouts with tight risk management and visual clarity.
Chart settings:
1. Select "Auto - Fits data to screen"
2. Please Select "Scale Price Chart Only" (To make the chart not squished)
### ✅ Entry Conditions
**Long Position:**
- Price closes above the 12-period Hull Moving Average.
- Price closes above the 5-period EMA shifted forward by 2 bars.
- RSI is above 50.
- Stochastic Oscillator (12,3,3) %K is above 50.
- Stochastic Oscillator (5,3,3) %K is above 50.
- Hull MA crosses above the shifted EMA.
**Short Position:**
- Price closes below the 12-period Hull Moving Average.
- Price closes below the 5-period EMA shifted forward by 2 bars.
- RSI is below 50.
- Stochastic Oscillator (12,3,3) %K is below 50.
- Stochastic Oscillator (5,3,3) %K is below 50.
- Hull MA crosses below the shifted EMA.
---
## 📉 Risk Management
- **Stop Loss:** Set at the low (for long) or high (for short) of the previous 2 candles.
- **Take Profit:** Calculated at a risk/reward ratio of **1.65x** the stop loss distance.
---
## 📊 Indicators Used
- **Hull Moving Average (12)**
- **Exponential Moving Average (5) **
- **Relative Strength Index (14)**
- **Stochastic Oscillators:**
- %K (12,3,3)
- %K (5,3,3)

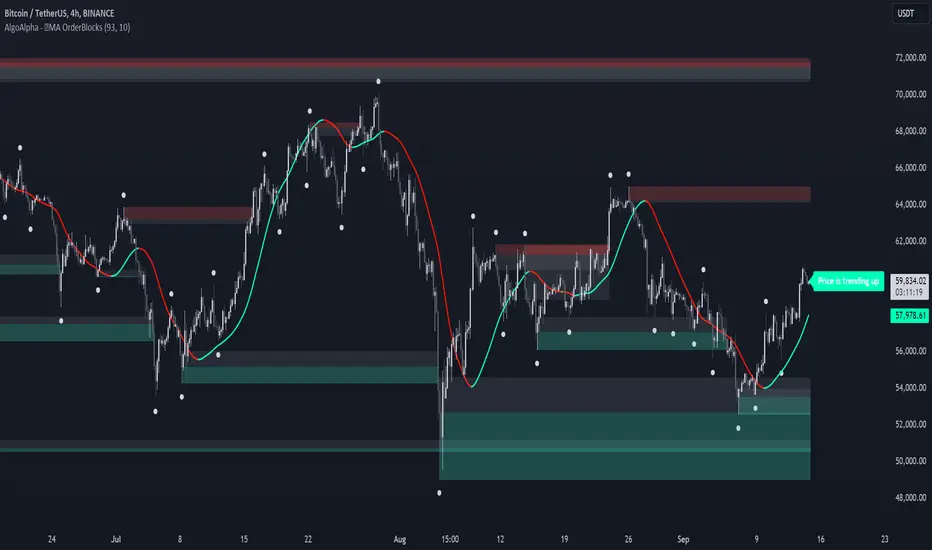
MA OrderBlocks [AlgoAlpha]🟨 HMA OrderBlocks by AlgoAlpha is a powerful tool designed to help traders visualize key pivot zones and order blocks based on the Hull Moving Average (HMA). By dynamically identifying bullish and bearish pivot points, this script provides insights into potential price reversals and trend continuations. With customizable settings, it allows traders to tweak the behavior of the indicator to match their strategies. Plus, it comes packed with built-in alerts for trend changes, making it easier to spot potential trade opportunities.
Key Features :
📊 Trend Detection : Utilizes Hull Moving Average to detect the current trend.
🟢🔴 Bullish & Bearish Zones : Automatically plots bullish and bearish order blocks, using customizable colors for clear visual cues.
🎯 Pivot Points : Detects and marks pivot highs and lows, helping traders spot key price reversals.
🚨 Alerts : Built-in alert system for when the price approaches key bullish or bearish zones, or when the trend changes.
🔨 Customizable MA: Choose from various moving averages (SMA, HMA, EMA, etc.) to suit your strategy.
How to Use :
⭐ Add the Indicator : Add the indicators to favourites by pressing the star icon. Once added, configure settings like the Hull MA period and pivot detection period.
📈 Analyze the Chart : Watch for the plotted order blocks and pivot points to identify possible price action strategies.
🔔 Enable Alerts : Set up alerts to be notified of potential trend reversals or when the price nears a bullish/bearish block.
How It Works :
The script starts by calculating the Hull Moving Average (HMA) based on the user-defined length, which is used to determine the market trend direction. It compares the current HMA value with the previous one to confirm whether the price is trending upwards or downwards. Once a trend change is detected, it plots bullish or bearish order blocks based on recent pivot highs and lows. These zones are extended in real-time as long as they remain invalidated. Zones are invalidated are invalidated when price completely closes through them. If the price gets close to a zone in the opposing direction, a warning system alerts the user that the block may not hold. Additionally, customizable alerts trigger whenever the price trend shifts or the price gets near important bullish/bearish blocks. The script’s logic ensures that order blocks are cleared if price violates them, keeping the chart clean and updated.
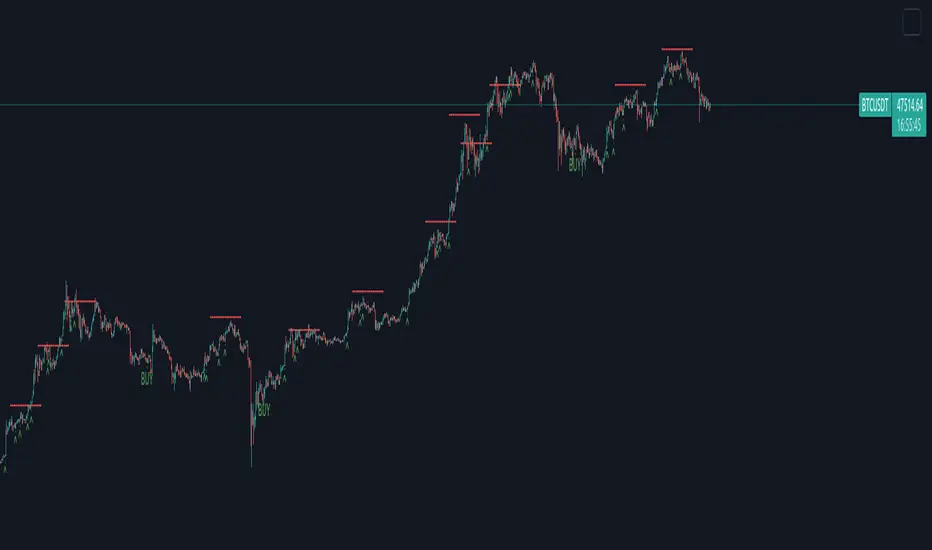
Creentrend Pressure SignalsThe hull moving average is my favorite moving average, as well as slower (55ma Bollinger Bands dev@(1.618)) is my favorite standard deviation indicator. Lets combine the two to evaluate overbought, oversold, and pressure.
Use for all time frames- I PREFER daily.
Bollinger band MA at 55
Hull ma at 55
The Hull is more reactive and faster than any band on the BB (both at 55)
When HULL closes BELOW LOWER BAND- it will print a buy signal, remember- over sold and overbought in VOLATILITY could be dangerous on low time frames, as swift moves typically have short term reversals but return to the main trend eventually, this is why i reccomend daily candles.
When PRICE closes ABOVE UPPER BOLLINGER BAND- it will print a green ^ signal under candle indicating upward pressure.
When HULL closes ABOVE UPPER BOLLINGER BAND- it will print a red resistance line. Complex tops happen a lot with bitcoin so take a 1-5% stop above it if shorting.