PJBG - HMA Smoothed VWMA [HMASVWMA]Problem: (1) lag of traditional MA's, (2) lack of Volume data in traditional MA's, and (3) choppiness of traditional MA's.
Solution: apply hull formula tick to tick, simply at a factor of 1:1.
Result: Smooth and fast MA that has volume data baked in it.
Benefit: See trend changes fast, and if it is supported by volume. Pleasant to the eyes.
Explanatory note: hull ma's generally cannot be volume weighted because the volume will spike the line tremendously.
Поиск скриптов по запросу "hull+ma通达信源码"

SulLaLuna — HTF M2 x Ultimate BB (Fusion) 🌕 **SulLaLuna — HTF M2 x Ultimate BB (Fusion)** 🚀💵
**By SulLaLuna Trading**
(Portions of the Bollinger Band logic adapted with permission/credit from the *Ultimate Buy & Sell Indicator* by its original author — thank you for the brilliance!)
---
🧭 **What This Is**
This is not just another price-following tool.
This is **a macro liquidity detector** — a **Daily Higher Timeframe Hull Moving Average of the Global M2 Money Supply**, smoothed via lower timeframe candles (default 5m, 48 Hull length), overlaid with **Ultimate-style double Bollinger Bands** to reveal *over-extension & mean reversion zones*.
It doesn’t chase candles.
It watches the tides beneath the market — the **money supply currents** that have a **direct correlation** to asset price behavior.
When liquidity expands → risk-on assets tend to rise.
When liquidity contracts → risk-off waves hit.
We ride those waves.
---
🔍 **What It Does**
* **Tracks Global M2** across major economies, FX-adjusted, and scales it to your chart’s price.
* **HTF Hull MA** (Daily, smoothed via 5m base) → gives you the macro liquidity trend.
* **Ultimate BB logic** applied to the HTF M2 Hull → inner/outer bands for volatility envelopes.
* **Pivot Labels** → ideal entry/exit zones on macro turns.
* **Over-Extension Alerts** → when HTF M2 Hull pushes outside the outer bands.
* **Re-Entry Alerts** → mean reversion triggers when liquidity moves back inside the range.
* **Background Paint** from chart TF M2 slope → for confluence on your entry timeframe.
---
📜 **Suggested How-To**
1. **Choose your execution chart** — e.g., 1–15m for scalps, 1H–4H for swings.
2. **Use the background paint** as your *local tide check* (chart TF M2 slope).
3. **Trade in the direction of the HTF M2 Hull** — green line = liquidity rising, red line = liquidity falling.
4. **Watch pivot labels** — these are potential “macro inflection” points.
5. **Confluence stack** — pair with ZLSMA, WaveTrend divergences, VWAP volume, or your favorite price-action setups.
6. **Size down** when HTF M2 Hull is flat/gray (chop zone).
7. **Scale in/out** on over-extension + re-entry alerts for higher probability swings.
---
⚠️ **Important Note**
This indicator **does not predict price** — it tracks macro liquidity flows that *influence* price.
Think of it as your market’s **tide chart**: when the water’s coming in, you can swim out; when it’s going out, you’d better be ready for the undertow.
---
📢 **Alerts Available**
* HTF Pivot HIGH / LOW
* Over-Extension (HTF Hull outside outer BB)
* Re-Entry (return from overbought/oversold)
---
🤝 **Join the SulLaLuna Tribe**
If this indicator helps you capture better entries, follow & share so more traders can learn to trade *math, not emotion*.
We rise together — **and we’ll meet you on the Moon** 🌕🚀💵.

Double CCI Confirmed Hull Moving Average Reversal StrategyOverview
The Double CCI Confirmed Hull Moving Average Strategy utilizes hull moving average (HMA) in conjunction with two commodity channel index (CCI) indicators: the slow and fast to increase the probability of entering when the short and mid-term uptrend confirmed. The main idea is to wait until the price breaks the HMA while both CCI are showing that the uptrend has likely been already started. Moreover, strategy uses exponential moving average (EMA) to trail the price when it reaches the specific level. The strategy opens only long trades.
Unique Features
Dynamic stop-loss system: Instead of fixed stop-loss level strategy utilizes average true range (ATR) multiplied by user given number subtracted from the position entry price as a dynamic stop loss level.
Configurable Trading Periods: Users can tailor the strategy to specific market windows, adapting to different market conditions.
Double trade setup confirmation: Strategy utilizes two different period CCI indicators to confirm the breakouts of HMA.
Trailing take profit level: After reaching the trailing profit activation level scrip activate the trailing of long trade using EMA. More information in methodology.
Methodology
The strategy opens long trade when the following price met the conditions:
Short-term period CCI indicator shall be above 0.
Long-term period CCI indicator shall be above 0.
Price shall cross the HMA and candle close above it with the same candle
When long trade is executed, strategy set the stop-loss level at the price ATR multiplied by user-given value below the entry price. This level is recalculated on every next candle close, adjusting to the current market volatility.
At the same time strategy set up the trailing stop validation level. When the price crosses the level equals entry price plus ATR multiplied by user-given value script starts to trail the price with EMA. If price closes below EMA long trade is closed. When the trailing starts, script prints the label “Trailing Activated”.
Strategy settings
In the inputs window user can setup the following strategy settings:
ATR Stop Loss (by default = 1.75)
ATR Trailing Profit Activation Level (by default = 2.25)
CCI Fast Length (by default = 25, used for calculation short term period CCI
CCI Slow Length (by default = 50, used for calculation long term period CCI)
Hull MA Length (by default = 34, period of HMA, which shall be broken to open trade)
Trailing EMA Length (by default = 20)
User can choose the optimal parameters during backtesting on certain price chart.
Justification of Methodology
Before understanding why this particular combination of indicator has been chosen let's briefly explain what is CCI and HMA.
The Commodity Channel Index (CCI) is a momentum-based technical indicator used in trading to measure a security's price relative to its average price over a given period. Developed by Donald Lambert in 1980, the CCI is primarily used to identify cyclical trends in a security, helping traders to spot potential buying or selling opportunities.
The CCI formula is:
CCI = (Typical Price − SMA) / (0.015 × Mean Deviation)
Typical Price (TP): This is calculated as the average of the high, low, and closing prices for the period.
Simple Moving Average (SMA): This is the average of the Typical Prices over a specific number of periods.
Mean Deviation: This is the average of the absolute differences between the Typical Price and the SMA.
The result is a value that typically fluctuates between +100 and -100, though it is not bounded and can go higher or lower depending on the price movement.
The Hull Moving Average (HMA) is a type of moving average that was developed by Alan Hull to improve upon the traditional moving averages by reducing lag while maintaining smoothness. The goal of the HMA is to create an indicator that is both quick to respond to price changes and less prone to whipsaws (false signals).
How the Hull Moving Average is Calculated?
The Hull Moving Average is calculated using the following steps:
Weighted Moving Average (WMA): The HMA starts by calculating the Weighted Moving Average (WMA) of the price data over a period square root of n (sqrt(n))
Speed Adjustment: A WMA is then calculated for half of the period n/2, and this is multiplied by 2 to give more weight to recent prices.
Lag Reduction: The WMA of the full period n is subtracted from the doubled n/2 WMA.
Final Smoothing: To smooth the result and reduce noise, a WMA is calculated for the square root of the period n.
The formula can be represented as:
HMA(n) = WMA(WMA(n/2) × 2 − WMA(n), sqrt(n))
The Weighted Moving Average (WMA) is a type of moving average that gives more weight to recent data points, making it more responsive to recent price changes than a Simple Moving Average (SMA). In a WMA, each data point within the selected period is multiplied by a weight, with the most recent data receiving the highest weight. The sum of these weighted values is then divided by the sum of the weights to produce the WMA.
This strategy leverages HMA of user given period as a critical level which shall be broken to say that probability of trend change to the upside increased. HMA reacts faster than EMA or SMA to the price change, that’s why it increases chances to enter new trade earlier. Long-term period CCI helps to have an approximation of mid-term trend. If it’s above 0 the probability of uptrend increases. Short-period CCI allows to have an approximation of short-term trend reversal from down to uptrend. This approach increases chances to have a long trade setup in the direction of mid-term trend when the short-term trend starts to reverse.
ATR is used to adjust the strategy risk management to the current market volatility. If volatility is low, we don’t need the large stop loss to understand the there is a high probability that we made a mistake opening the trade. User can setup the settings ATR Stop Loss and ATR Trailing Profit Activation Level to realize his own risk to reward preferences, but the unique feature of a strategy is that after reaching trailing profit activation level strategy is trying to follow the trend until it is likely to be finished instead of using fixed risk management settings. It allows sometimes to be involved in the large movements. It’s also important to make a note, that script uses HMA to enter the trade, but for trailing it leverages EMA. It’s used because EMA has no such fast reaction to price move which increases probability not to be stopped out from any significant uptrend move.
Backtest Results
Operating window: Date range of backtests is 2022.07.01 - 2024.08.01. It is chosen to let the strategy to close all opened positions.
Commission and Slippage: Includes a standard Binance commission of 0.1% and accounts for possible slippage over 5 ticks.
Initial capital: 10000 USDT
Percent of capital used in every trade: 100%
Maximum Single Position Loss: -4.67%
Maximum Single Profit: +19.66%
Net Profit: +14897.94 USDT (+148.98%)
Total Trades: 104 (36.54% win rate)
Profit Factor: 2.312
Maximum Accumulated Loss: 1302.66 USDT (-9.58%)
Average Profit per Trade: 143.25 USDT (+0.96%)
Average Trade Duration: 34 hours
These results are obtained with realistic parameters representing trading conditions observed at major exchanges such as Binance and with realistic trading portfolio usage parameters.
How to Use
Add the script to favorites for easy access.
Apply to the desired timeframe and chart (optimal performance observed on 2h BTC/USDT).
Configure settings using the dropdown choice list in the built-in menu.
Set up alerts to automate strategy positions through web hook with the text: {{strategy.order.alert_message}}
Disclaimer:
Educational and informational tool reflecting Skyrex commitment to informed trading. Past performance does not guarantee future results. Test strategies in a simulated environment before live implementation

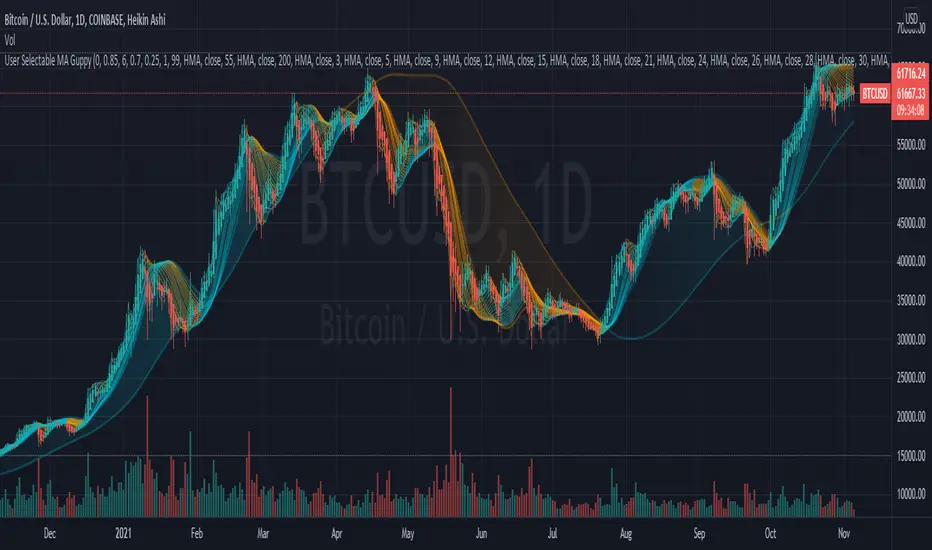
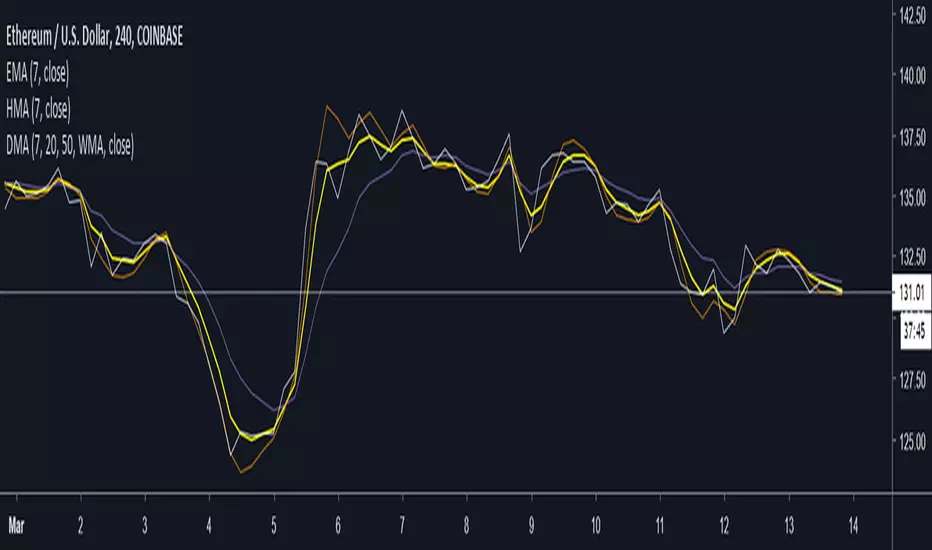
User Selectable Moving Average GuppyA version of the popular "Moving Average Ribbon" or "Guppy" indicators, except nearly everything about it is user selectable. The user can change the source, period, and type of moving average used for every single line on the chart. Note: The visuals are fairly intensive and may take a moment to catch up after adjusting settings.
Credit: This script utilizes the "Color Gradient Framework" tutorial by LucF (PineCoders) to create gradient visuals, which are also customizable for the user.
Moving Average Options:
Running (SMoothed) Moving Average (RMA or SMMA) - Slowest
Simple Moving Average (SMA) - Slow
Exponential Moving Average (EMA) - Responds faster to price than SMA
Weighted Moving Average (WMA)
Volume-Weighted Moving Average (VWMA)
Triple EMA (TEMA)
Exponential Hull Moving Average (EHMA) - Hull with Smoothing (Slower than Hull)
Least Squares Moving Average (LSMA) - Simple Linear Regression
Arnaud Legoux Moving Average (ALMA) - Adjustable, set offset=1 to be current, offset=0.85 for good smoothing (Slower)
Hull Moving Average (HMA) - Normally responds fastest to price of all options
Value Added :
This script is unique in that it allows the user to chart the "Guppy", except nearly everything about it is customizable. The user can change the source, period, and type of moving average used for every single line.
Typically, the Guppy is plotted with simple moving average or exponential moving average, which respond much slower to price than the Hull Moving Average, which this indicator uses as default. (Elimination of lag)
The Hull MA settings for the highest time frame moving averages should work well for assessing the overall macro trend, with a nice visual presentation. Additional labels and alerts for the macro trend are available.
Furthermore, this script provides many more options for type of moving average than is typical for a moving average indicator that provides the user with options, including advanced options such as Hull, TEMA, and ALMA.
The visual presentation is customizable and should provide some entertainment for users who want to create pretty charts.
MA Cloud + Linha Média🧠 Description of “MA Cloud + Average Line” Indicator
This Pine Script indicator combines multiple moving averages (MAs) into a dynamic visualization that helps traders identify market trends, momentum shifts, and trend strength. It creates a colored cloud between the fastest and slowest moving averages, and also plots an average line representing the mean of all active MAs.
⚙️ 1. Core Features
Multiple Moving Averages (MAs)
Supports up to four customizable moving averages (MA1, MA2, MA3, MA4).
Each MA can use different types:
SMA (Simple Moving Average)
EMA (Exponential Moving Average)
WMA (Weighted Moving Average)
VWMA (Volume-Weighted Moving Average)
RMA (Smoothed Moving Average)
Hull MA (Hull Moving Average)
LSMA (Least Squares Moving Average)
The trader can define each MA’s period, color, and choose whether it’s active or not.
Trend Color Coding
Each MA changes color based on its slope:
Green (or chosen “Up Color”) when rising
Red (or chosen “Down Color”) when falling
This gives instant visual feedback on short-term direction.
MA Cloud (Trend Zone)
When the “Cloud” is active, the area between the minimum and maximum of all active MAs is shaded.
The cloud changes color based on alignment:
🟩 Green Cloud – all MAs are aligned upward (strong bullish trend).
🟥 Red Cloud – all MAs are aligned downward (strong bearish trend).
⚪ Gray Cloud – mixed alignment (no clear trend / consolidation).
Average Line (Mean of All MAs)
Calculates the average of all active MAs and plots it as a central “mean” line.
Serves as a dynamic trend guide — when price is above it, the market tends to be bullish; below it, bearish.
The color of the line follows the current cloud color for consistency.
📈 2. How It Helps Identify Trends
This indicator provides multiple layers of trend confirmation:
Visual Element Interpretation Trend Insight
MA Slope Color Green (Up) / Red (Down) Short-term momentum direction
MA Cloud Color Green / Red / Gray Overall trend alignment across timeframes
Average Line Mean of all MAs Acts as a “trend equilibrium” line
Price vs. Average Line Above = Bullish / Below = Bearish Confirms trend bias
🔍 3. Example Use Cases
Trend Following
Enter long trades when all MAs are aligned (Cloud = Green) and price is above the average line.
Enter short trades when the Cloud is Red and price is below the average line.
Trend Strength Confirmation
The wider the distance between MAs (thicker cloud), the stronger the ongoing trend.
A narrowing cloud or color shift (green → gray → red) can warn of trend reversal or consolidation.
Dynamic Support and Resistance
The MA Cloud acts as a support zone in uptrends and resistance zone in downtrends.
Traders can use the edges of the cloud to identify possible pullback entry zones.
Multi-Timeframe Analysis
By using fast MAs (e.g., 20/50) and slow MAs (100/200), traders can visualize short-term vs. long-term trend interaction, similar to “Golden Cross” and “Death Cross” setups.
🧩 4. How to Use It Practically
Step 1: Enable only the MAs you need (e.g., 20, 50, 200).
Step 2: Observe the cloud color:
🟩 Green → Favor long trades
🟥 Red → Favor short trades
⚪ Gray → Wait for confirmation
Step 3: Use the average line as a filter:
Trade only in the direction of the average line’s slope.
Step 4: Combine with volume, RSI, or price action to refine entries.
💬 Summary
Indicator Name: MA Cloud + Average Line
Purpose: Visual trend detection and confirmation
Best For: Swing and trend-following traders
Signals Provided:
Trend alignment (via color-coded cloud)
Momentum shifts (via MA color changes)
Dynamic support/resistance (via cloud zones)
Overall trend bias (via average line)

DAMA OSC - Directional Adaptive MA OscillatorOverview:
The DAMA OSC (Directional Adaptive MA Oscillator) is a highly customizable and versatile oscillator that analyzes the delta between two moving averages of your choice. It detects trend progression, regressions, rebound signals, MA cross and critical zone crossovers to provide highly contextual trading information.
Designed for trend-following, reversal timing, and volatility filtering, DAMA OSC adapts to market conditions and highlights actionable signals in real-time.
Features:
Support for 11 custom moving average types (EMA, DEMA, TEMA, ALMA, KAMA, etc.)
Customizable fast & slow MA periods and types
Histogram based on percentage delta between fast and slow MA
Trend direction coloring with “Green”, “Blue”, and “Red” zones
Rebound detection using close or shadow logic
Configurable thresholds: Overbought, Oversold, Underbought, Undersold
Optional filters: rebound validation by candle color or flat-zone filter
Full visual overlay: MA lines, crossover markers, rebound icons
Complete alert system with 16 preconfigured conditions
How It Works:
Histogram Logic:
The histogram measures the percentage difference between the fast and slow MA:
hist_value = ((FastMA - SlowMA) / SlowMA) * 100
Trend State Logic (Green / Blue / Red):
Green_Up = Bullish acceleration
Blue_Up (or Red_Up, depending the display settings) = Bullish deceleration
Blue_Down (or Green_Down, depending the display settings) = Bearish deceleration
Red_Down = Bearish acceleration
Rebound Logic:
A rebound is detected when price:
Crosses back over a selected MA (fast or slow)
After being away for X candles (rebound_backstep)
Optional: filtered by histogram zones or candle color
Inputs:
Display Options:
Show/hide MA lines
Show/hide MA crosses
Show/hide price rebounds
Enable/disable blue deceleration zones
DAMA Settings:
Fast/Slow MA type and length
Source input (close by default)
Overbought/Oversold levels
Underbought/Undersold levels
Rebound Settings:
Use Close and/or Shadow
Rebound MA (Fast/Slow)
Candle color validation
Flat zone filter rebounds (between UnderSold and UnderBought)
Available MA type:
SMA (Simple MA)
EMA (Exponential MA)
DEMA (Double EMA)
TEMA (Triple EMA)
WMA (Weighted MA)
HMA (Hull MA)
VWMA (Volume Weighted MA)
Kijun (Ichimoku Baseline)
ALMA (Arnaud Legoux MA)
KAMA (Kaufman Adaptive MA)
HULLMOD (Modified Hull MA, Same as HMA, tweaked for Pine v6 constraints)
Notes:
**DEMA/TEMA** reduce lag compared to EMA, useful for faster reaction in trending markets.
**KAMA/ALMA** are better suited to noisy or volatile environments (e.g., BTC).
**VWMA** reacts strongly to volume spikes.
**HMA/HULLMOD** are great for visual clarity in fast moves.
Alerts Included (Fully Configurable):
Golden Cross:
Fast MA crosses above Slow MA
Death Cross:
Fast MA crosses below Slow MA
Bullish Rebound:
Rebound from below MA in uptrend
Bearish Rebound:
Rebound from above MA in downtrend
Bull Progression:
Transition into Green_Up with positive delta
Bear Progression:
Transition into Red_Down with negative delta
Bull Regression:
Exit from Red_Down into Blue/Green with negative delta
Bear Regression:
Exit from Green_Up into Blue/Red with positive delta
Crossover Overbought:
Histogram crosses above Overbought
Crossunder Overbought:
Histogram crosses below Overbought
Crossover Oversold:
Histogram crosses above Oversold
Crossunder Oversold:
Histogram crosses below Oversold
Crossover Underbought:
Histogram crosses above Underbought
Crossunder Underbought:
Histogram crosses below Underbought
Crossover Undersold:
Histogram crosses above Undersold
Crossunder Undersold:
Histogram crosses below Undersold
Credits:
Created by Eff_Hash. This code is shared with the TradingView community and full free. do not hesitate to share your best settings and usage.

Triangular Hull Moving Average [BigBeluga X PineIndicators]This strategy is based on the original Triangular Hull Moving Average (THMA) + Volatility indicator by BigBeluga. Full credit for the concept and design goes to BigBeluga.
The strategy blends smoothed trend-following logic using a Triangular Hull Moving Average with dynamic volatility overlays, providing actionable trade signals with responsive visual feedback. It's designed for traders who want a non-lagging trend filter while also monitoring market volatility in real time.
How the Strategy Works
1. Triangular Hull Moving Average (THMA) Core
At its core, the strategy uses a Triangular Hull Moving Average (THMA) — a variation of the traditional Hull Moving Average with triple-smoothing logic:
It combines multiple weighted moving averages (WMAs) to create a faster and smoother trend line.
This reduces lag without compromising trend accuracy.
The THMA reacts more responsively to price movements than classic MAs.
THMA Formula:
thma(_src, _length) =>
ta.wma(ta.wma(_src,_length / 3) * 3 - ta.wma(_src, _length / 2) - ta.wma(_src, _length), _length)
This logic filters out short-term noise while still being sensitive to genuine trend shifts.
2. Volatility-Enhanced Candle Plotting
An optional volatility mode overlays the chart with custom candles that incorporate volatility bands:
Wicks expand and contract dynamically based on market volatility.
The volatility value is computed using a HMA of high-low range over a user-defined length.
The candle bodies reflect THMA values, while the wicks reflect the current volatility spread.
This feature allows traders to visually gauge the strength of price moves and anticipate possible breakouts or slowdowns.
3. Trend Reversal Signal Detection
The strategy identifies trend reversals when the THMA line crosses over/under its own past value:
A bullish signal is triggered when THMA crosses above its value from two bars ago.
A bearish signal is triggered when THMA crosses below its value from two bars ago.
These shifts are marked on the chart with triangle-shaped signals for clear visibility.
This logic helps detect momentum shifts early and enables reactive trade entries.
Trade Entry & Exit Logic
Trade Modes Supported
Users can choose between:
Only Long – Enters long trades only.
Only Short – Enters short trades only.
Long & Short – Enables both directions.
Entry Conditions
Long Entry:
Triggered when a bullish crossover is detected.
Active only if the strategy mode allows long trades.
Short Entry:
Triggered when a bearish crossover is detected.
Active only if the strategy mode allows short trades.
Exit Conditions
In Only Long mode, the strategy closes long positions when a bearish signal appears.
In Only Short mode, the strategy closes short positions when a bullish signal appears.
In Long & Short mode, the strategy does not auto-close positions — instead, it opens new positions on each confirmed signal.
Dashboard Visualization
In the bottom-right corner of the chart, a live dashboard displays:
The current trend direction (🢁 for bullish, 🢃 for bearish).
The current volatility level as a percentage.
This helps traders quickly assess market status and adjust their decisions accordingly.
Customization Options
THMA Length: Adjust how smooth or reactive the trend detection should be.
Volatility Toggle & Length: Enable or disable volatility visualization and set sensitivity.
Color Settings: Choose colors for up/down trend visualization.
Trade Direction Mode: Limit the strategy to long, short, or both types of trades.
Use Cases & Strategy Strengths
1. Trend Following
Use the THMA-based candles and triangle signals to enter with momentum. The indicator adapts quickly, reducing lag and improving trade timing.
2. Volatility Monitoring
Visualize the strength of the trend with volatility wicks. Use expanding bands to confirm breakouts and contracting ones to detect weakening moves.
3. Signal Confirmation
Combine this tool with other indicators or use the trend shift triangles as confirmations for manual entries.
Conclusion
The THMA + Volatility Strategy is a non-repainting trend-following system that integrates:
Triangular Hull MA for advanced trend detection.
Real-time volatility visualization.
Clear entry signals based on trend reversals.
Configurable trade direction settings.
It is ideal for traders who:
Prefer smoothed price analysis.
Want to follow trends with precision.
Value visual volatility feedback for breakout detection.
Full credit for the original concept and indicator goes to BigBeluga.

Exponential Hull Moving Average (EHMA)Source for Exponential Hull Moving Average (EHMA) formula:
Raudys, Aistis & Lenčiauskas, Vaidotas & Malčius, Edmundas. (2013). Moving Averages for Financial Data Smoothing. Communications in Computer and Information Science. 403. 34-45. 10.1007/978-3-642-41947-8_4.
The Exponential Hull Moving Average is nearly identical to the Hull MA, but EMA used instead of WMA.
Credit to @RicardoSantos for the existing implementation of the Hull Moving Average in pinescript:

Trend Mastery:The Calzolaio Way🌕 Find the God Candle. Capture the gains. Create passive income.
Fellow F.I.R.E. Decibels, disciples of the Calzolaio Way—welcome to the sacred toolkit. This indicator, "SulLaLuna 💵 Trend Mastery:The Calzolaio Way🚀," is forged from the elite SulLaLuna stack, drawing wisdom from Market Wizards like Michael Marcus (who turned $30k into $80M through disciplined trend riding) and Oliver Velez's pristine strategies for profiting on every trade. It's not just lines on a chart—it's your architectural blueprint for financial sovereignty, where data meets divine timing to build the cathedral of Project Calzolaio.
We trade math, not emotion. We honor timeframes. Confluence is King. This indicator deploys the Zero-Lag SMA (ZLSMA), Hull-based M2 (global money supply as a macro trend oracle), ATR-smart stops, and multi-TF alignments to ritualize God Candle setups. Backtested across asset classes, it's modular for your playbooks—small risks, compounding gains, passive income streams.
Why This Indicator is Awesome: The Divine Confluence Engine
In the spirit of "Use Only the Best," this tool synthesizes proven SulLaLuna indicators like ZLSMA, Adaptive Trend Finder, and Momentum HUD with Velez's lessons on trend reversals, support/resistance, and psychology of fear. Here's why it reigns supreme:
1. Global M2 Hull: Macro Trend Oracle
Scaled M2 (summed from major economies like US, EU, JP) via Hull MA captures the "big picture" (Velez Ch. 2). It flips colors as S/R—green for support (bullish bounce zones), red for resistance (bearish ceilings), orange neutral. Like Marcus spotting commodity booms, it signals when liquidity sweeps ignite God Candles. Extend it for future price projections, honoring "How a Trend Ends" (Velez Ch. 5).
2. ZLSMA + ATR Smart Stops: Surgical Precision
Zero-Lag SMA (faster than standard MAs) crosses M2 for entries, with ATR bands for initial stops (2x mult) and trails (1x mult). This embodies "Trade Small. Lose Smaller."—risk ≤1-2% per trade, pre-planned exits. Flip markers (↑/↓) alert divine timing, filtering noise like Velez's "First Pullback" setups.
3. HTF & Multi-TF Dashboard: Timeframe Alignments are Sacred
Show HTF M2 (e.g., Daily) with custom styles/colors. Multi-TF lines (4H, D, W, M) dash across your chart, labeled right-edge with 🚀 (bull) or 🛸 (bear). A confluence table (top-right) scores alignments: Strong Bull (≥3 green), Strong Bear, or Mixed. This is "Confluence is King"—no single signal rules; seek 4+ star scores like Rogers buying value in hysteria.
4. Background & Ribbon: Visual Divine Guidance
Slope-based bgcolor (green bull, red bear) for at-a-glance bias. M2 Ribbon (EMA cloud) flips triangles for macro shifts, ritualizing climactic reversals (Velez Ch. 7).
5. Composite Probability: High-Prob God Candle Hunter
Scores (0-100%) blend 8 factors: price/ZLSMA vs M2, TF slopes, ribbon. Threshold (70%) + pivot zone (near M2/ATR) + optional cross filters for HP signals. Labels show "%" dynamically—alerts fire when confluence ≥4, echoing Schwartz's champion edge: "Everybody Gets What They Want" (Seykota wisdom).
6. Alerts & Rituals Built-In
M2 flips, entries/exits, HP longs/shorts—log them in your journal. Weekly reviews dissect anomalies, as per our Operational Framework.
This isn't hype—it's audited excellence. Backtest it: High confluence crushes drawdowns, compounding like Bielfeldt's T-bond mastery from Peoria. We build together; share wins in the F.I.R.E. Decibel forum.
Suggested Strategy: The SulLaLuna M2 Confluence Playbook
Honor the Risk Triad: Position ↓ if leverage/timeframe ↑; scale ↑ only on ≥4 confluence. Align with "God Candle" hunts—rare explosives reverse-engineered for passive streams.
1. Pre-Trade Checklist (Before Every Entry)
- Trend Alignment: D/4H/1H M2 slopes agree? Table shows Strong Bull/Bear?
- Signal on 15m: ZLSMA crosses M2 in confluence zone (near pivot/ATR bands).
- Volume + Divergence**: Supported by volume (use HUD if added); score ≥70%.
- SL/TP Setup: ATR-based stop; TP at structure/2-3R reward (Velez Reward:Risk).
- HTF Agrees: Monthly bull for longs; avoid counter-trend unless climactic (Ch. 7).
Confluence Score: Rate 1-5 stars. <3? Stand aside. Log emotional state—no adrenaline.
2. Execution Protocol
- Entry: On HP Long/Short triangle (e.g., ZLSMA > M2, score 80%+, monthly bull). Use limits; favor longs above M2 support.
- Position Size: ≤1-2% risk. Example: $10k account, 1% risk = $100 SL distance → size accordingly.
- Trail Stops: Move to trail band after 1R profit; let winners run like Kovner's world trades.
- Asset Classes**: Forex/stocks/crypto—test M2's macro edge on EURUSD or NASDAQ (Velez Ch. 6 reviews).
Ritualize: "When we find the God Candele, we don’t just ride it—we ritualize it." Screenshot + reason.
3. Post-Trade Ritual
- Document: Result, confluence score, lessons. Update journal.
- Exits: Hit stop/exit cross? Or trail locks gains.
- Weekly Audit: Wins/losses, anomalies. Adjust params (e.g., M2 length 55 default).
4. Risk Triad in Action
- Low TF (15m)? Smaller size.
- High Leverage? Tiny positions.
- Confluence ≥4 + HTF support? Scale hold for passive compounding.
Example Setup: God Candle Long
- Chart: 15m EURUSD.
- M2 Hull green (support), ZLSMA crossover, 4H/D/W bull (table: Strong Bull).
- HP Long (85% score) near pivot.
- Entry: Limit at cross; SL below ATR lower; TP at next resistance.
- Outcome: Capture 2R gain; trail for more if trend day (Velez Ch. 5).
Community > Ego: Test, share signals in Discord. Backtest in Pine Script for algo evolution.
We are architects of redemption. Each trade bricks the cathedral. Trade the micro, flow with the macro. When alignments converge, we act—with discipline, data, and divine purpose.

3 HULLs & ICHIMOKU divided by PRICEBasically just another form of moving average, for quick swings, built for testing/use with API cryptobots, simple switch from buy to sell.
Hull MA(2 candles back) times 3 plus Ichimoku divided by price(1 candle back) = value1
Hull MA(3 candles back) times 3 plus Ichimoku divided by price(1 candle back) = value2
if value1>value2 then buy else sell
calculates price from 1 candle back, and calculates signal from 2nd and 3rd candle prices, so no repainting? so best on low timeframes.
for when use in bot, would not need 1 candle lag. Lag is for TV chartists to not have to suffer repainting.
Bots do not repaint. they are not "painting" anything, they simply open or close orders, which cannot be "repainted"
but here on TV chart, when you refresh the browser page, the script recalculates, and signals may be repainted.
hopefully this will not repaint. please test. thankyou

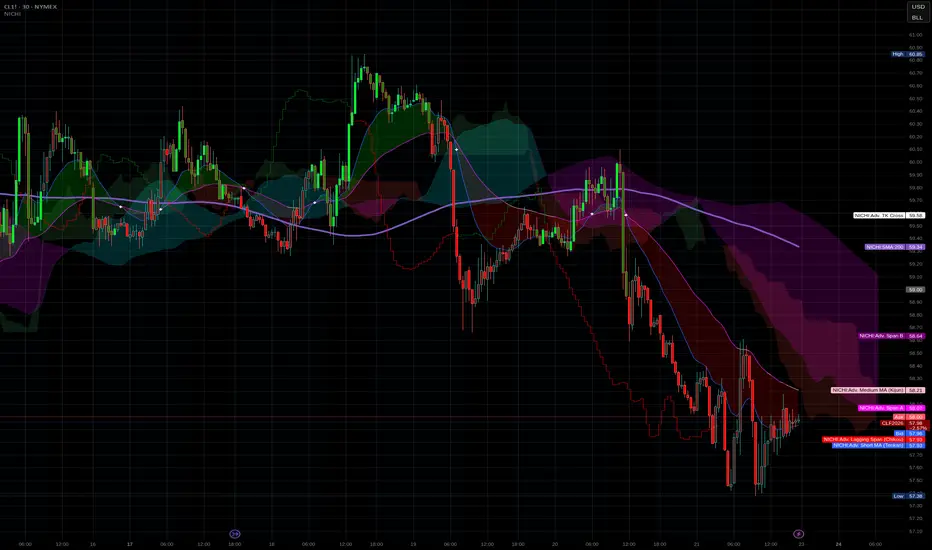
NICHI Beta (NuwenPham's Ichimoku)# **NuwenPham’s Ichimoku (NICHI)**
**Version BETA.251123a.3.1.2 – Pine Script v6**
**Author:** NuwenPham
**Forked from:** Donovan Wall
**Contributors:** Claude (Anthropic)
**License:** MPL 2.0
---
# **Overview**
**NICHI (Nuwen’s Ichimoku)** is a next-generation Ichimoku system that merges the classical Hosoda Ichimoku with a modular adaptive-smoothing engine, enhanced Kumo logic, directional trend counters, and multi-mode bar coloring.
The indicator includes **two completely separate Ichimoku engines**:
* **Standard Ichimoku** – Traditional Donchian-based Tenkan, Kijun, Senkou A/B, and Chikou
* **Advanced Ichimoku** – Fully customizable Ichimoku using 15+ moving-average filters and enhanced logic
NICHI is designed for modern markets—especially **futures and volatile instruments** (NG, CL, ES, NQ, crypto).
---
# **Key Features**
## **1. Dual Ichimoku Systems**
* **Standard Mode:**
Classic Donchian Ichimoku with Tenkan, Kijun, Senkou A/B, and Chikou.
Clean, faithful implementation.
* **Advanced Mode:**
Every Ichimoku line uses a **selected smoothing filter** (EMA, KAMA, FRAMA, Hull, McGinley, etc.).
Includes directional persistence tracking, enhanced cloud logic, and adaptive bar coloring.
---
## **2. Advanced Filter Engine (15+ Smooth Types)**
Use any of the following for Tenkan, Kijun, Senkou B, or Chikou:
* EMA
* DEMA
* SMA
* SMMA (RMA)
* WMA
* VWMA
* Hull MA
* ALMA
* LSMA (Linear Regression)
* McGinley Dynamic
* KAMA
* FRAMA
* COVWMA
* Moving Median
* 50th Percentile (Nearest Rank)
This transforms Ichimoku into an **adaptive trend system**.
---
## **3. Enhanced Cloud (Kumo) Modeling**
* Independent forward offsets for Span A & Span B
* Cloud colors adapt based on strength, direction, and filter behavior
* Cloud thickness reflects volatility
* Neutral cloud state available when spans disagree
---
## **4. Directional Persistence Counters**
NICHI tracks the **trend streak** of each main component:
* Tenkan rising/falling
* Kijun rising/falling
* Span A rising/falling
* Span B rising/falling
These counters make cloud and line colors more accurate and stable.
---
## **5. Regime-Based Bar Coloring (3 Modes)**
NICHI includes three built-in trading frameworks:
### **Mode 1: Kumo-Based**
Bar color reflects price relative to the cloud:
* Green = Above Kumo
* Red = Below Kumo
* Orange = Inside Kumo
Ideal for **trend-following** and **market regime detection**.
---
### **Mode 2: Tenkan/Kijun-Based**
Bar color reflects momentum structure:
* Green = Price above both Tenkan & Kijun
* Red = Price below both
Designed for **momentum entries and TK breakouts**.
---
### **Mode 3: Chikou-Based**
Bars reflect historical confirmation:
* Green = Chikou > price (offset period)
* Red = Chikou < price
Excellent for **confirmation-first strategies** where accuracy matters most.
---
## **6. Multi-MA Overlay System**
Up to **four optional moving averages**:
* SMA, EMA, SMMA, WMA, HMA, VWMA
* Independent lengths, widths, colors
* Useful for bias, confluence, trend filters
Default: **SMA 200** enabled.
---
## **7. TK Cross Signals**
Both systems show TK crosses:
* Standard TK Cross (classic)
* Advanced TK Cross (filtered version)
Crosses appear with clear markers for entry/exit logic.
---
# **How to Use NICHI**
## **1. Choose Your Engine**
* **Standard:** Clean, classic Ichimoku
* **Advanced:** Adaptive, filter-driven Ichimoku
* **Both:** Comparative analysis
---
## **2. Select Your Filter Type (Advanced Mode)**
Suggested filters:
| Market | Filter Type | Notes |
| ---------------- | ---------------- | -------------------------- |
| Natural Gas (NG) | KAMA or FRAMA | Handles extreme volatility |
| Crude Oil (CL) | McGinley Dynamic | Smooths spikes |
| ES / NQ | SMMA or WMA | Balanced response |
| Crypto | Hull or ALMA | Handles momentum bursts |
| FX | EMA or SMMA | Classic, stable |
---
## **3. Choose a Bar-Color Strategy**
* **Kumo-Based:** Trend following
* **TK-Based:** Momentum and breakouts
* **Chikou-Based:** Highest confirmation/accuracy
Each strategy is valid and intentionally distinct.
---
## **4. Reading the Cloud**
* **Bullish Cloud:** Span A > Span B
* **Bearish Cloud:** Span A < Span B
* **Neutral Cloud:** Disagreement between spans
* **Thick Cloud:** High volatility / stronger structure
* **Thin Cloud:** Weak trend / potential twist
---
## **5. Entry & Exit Concepts**
### **Entries**
* **Momentum Entry:** TK cross with price above the cloud
* **Reversal Entry:** TK cross before a cloud twist
* **Confirmation Entry:** Chikou breaks cleanly above/below past price
### **Exits**
* Price falling through Kijun
* Re-entering the cloud
* Opposite TK cross
* Cloud flipping against position
---
# **Recommended Trading Approaches**
## **Kumo-Based Trend Strategy**
* Long above cloud, short below
* Avoid signals inside cloud
Best for swing/position trading.
---
## **TK-Based Momentum Strategy**
* Enter on Tenkan/Kijun breakout
* Bar color confirms momentum
* Cloud filter optional but helps
Great for high-velocity markets.
---
## **Chikou-Based Confirmation Strategy**
* Enter only when Chikou confirms structure
* Highest accuracy, fewest trades
* Ideal for volatile markets (NG, CL)
---
# **Closing Notes**
NICHI is a **research-grade Ichimoku framework** designed to handle modern volatility where traditional Ichimoku often fails.
It supports scalpers, swing traders, and system developers alike.
Experiment with:
* Filter types
* Cloud offsets
* Bar-color modes
* MA overlays
to match your strategy and market.
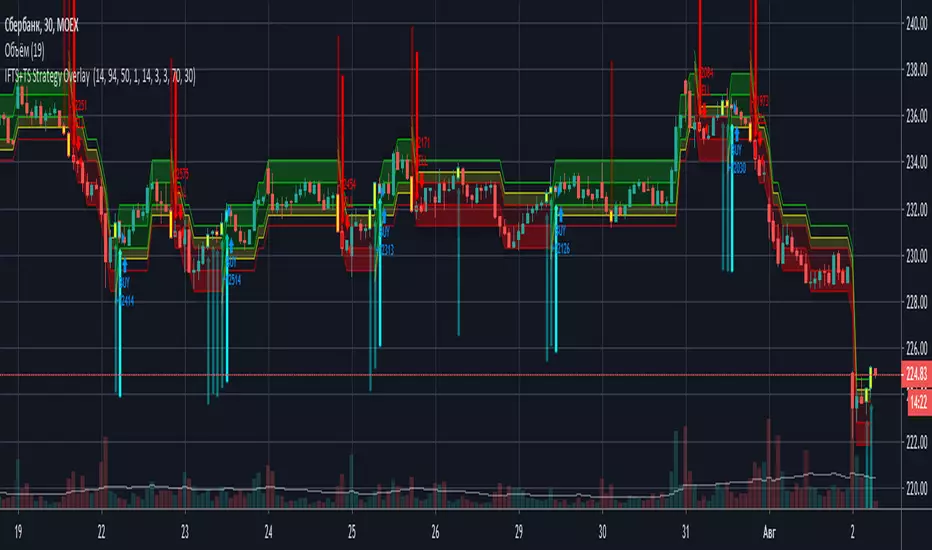
IFTS+TS Strategy OverlayInverse Fisher transform on stochastic with Hull MA and Donchian Channels with oversell/overbuy levels and dynamic trailing stop
Options:
Fixed trailing stop
Dynamic, based on ATR trailing stop
Re-enter after trailing stop
Includes Hull MA
Hull MA filtration for re-entering after trailing stop
Donchian channels, with overbuy/oversell levels
No repaints
HMA=WMA(2*WMA(n/2)−WMA(n)),sqrt(n))3 Hull moving averages
Hull MA 1 (shortest period) crossing Hull MA 2 is buy and sell signal, 3rd MA (longest period) to show overall trend
Pivots included

Dickinson Moving Average (DMA)Implementation of the "Dickinson Moving Average" from the r/algotrading post by Nathan Dickinson
Quoted from the author of the Dickinson Moving Average:
"I was experimenting with the “zero lag” code from John Ehlers and the Hull Moving Average and noticed that they seemed to respond in complementary ways when properly set up. With the right starting values, they blend together to make a moving average which responds with one (or maybe even half a bar) of lag. To my eye, it looks to be almost as good as the Jurik Moving Average."
Optional parameter input available to use Exponential Hull Moving Average (EHMA) instead of WMA for the Hull MA is available.
Acknowledgements/Credits:
Nathan Dickinson, Dickinson Moving Average
@RicardoSantos, Function for Hull Moving Average
Exponential Hull Moving Average sourced from:
// Raudys, Aistis & Lenčiauskas, Vaidotas & Malčius, Edmundas. (2013). Moving Averages for Financial Data Smoothing.
// Communications in Computer and Information Science. 403. 34-45. 10.1007/978-3-642-41947-8_4.
@Everget, Jurik Moving Average
Strategy Myth-Busting #1 - UT Bot+STC+Hull [MYN]This is part of a new series we are calling "Strategy Myth-Busting" where we take open public manual trading strategies and automate them. The goal is to not only validate the authenticity of the claims but to provide an automated version for traders who wish to trade autonomously.
Our first one is an automated version of the " The ULTIMATE Scalping Trading Strategy for 2022 " strategy from " My Trading Journey " who claims to have achieved not only profits but a 98.3% win rate. As you can see from the backtest results below, I was unable to substantiate anything close to that that claim on the same symbol (NVDA), timeframe (5m) with identical instrument settings that " My Trading Journey " was demonstrating with. Strategy Busted.
If you know of or have a strategy you want to see myth-busted or just have an idea for one, please feel free to message me.
This strategy uses a combination of 3 open-source public indicators:
UT Bot Alerts by QuantNomad
STC Indicator - A Better MACD By shayankm
Basic Hull Ma Pack tinkered by InSilico
Trading Rules:
5 min candles
Long
New Buy Signal from UT Bot Alerts Strategy
STC is green and below 25 and rising
Hull Suite is green
Short
New Sell Signal from UT Bot Alerts Strategy
STC is red and above 75 and falling
Hull Suite is red

Trend Flow Trail [AlgoAlpha]OVERVIEW
This script overlays a custom hybrid indicator called the Money Flow Trail which combines a volatility-based trend-following trail with a volume-weighted momentum oscillator. It’s built around two core components: the AlphaTrail—a dynamic band system influenced by Hull MA and volatility—and a smoothed Money Flow Index (MFI) that provides insights into buying or selling pressure. Together, these tools are used to color bars, generate potential reversal markers, and assist traders in identifying trend continuation or exhaustion phases in any market or timeframe.
CONCEPTS
The AlphaTrail calculates a volatility-adjusted channel around price using the Hull Moving Average as the base and an EMA of range as the spread. It adaptively shifts based on price interaction to capture trend reversals while avoiding whipsaws. The direction (bullish or bearish) determines both the band being tracked and how the trail locks in. The Money Flow Index (MFI) is derived from hlc3 and volume, measuring buying vs selling pressure, and is further smoothed with a short Hull MA to reduce noise while preserving structure. These two systems work in tandem: AlphaTrail governs directional context, while MFI refines the timing.
FEATURES
Dynamic AlphaTrail line with regime switching logic that controls directional bias and bar coloring.
Smoothed MFI with gradient coloring to visually communicate pressure and exhaustion levels.
Overbought/oversold thresholds (80/20), mid-level (50), and custom extreme zones (90/10) for deeper signal granularity.
Built-in take-profit signal logic: crossover of MFI into overbought with bullish AlphaTrail, or into oversold with bearish AlphaTrail.
Visual fills between price and AlphaTrail for clearer confirmation during trend phases.
Alerts for regime shifts, MFI crossovers, trail interactions, and bar color regime changes.
USAGE
Add the indicator to any chart. Use the AlphaTrail plot to define trend context: bullish (trailing below price) or bearish (trailing above). MFI values give supporting confirmation—favor long setups when MFI is rising and above 50 in a bullish regime, and shorts when MFI is falling and below 50 in a bearish regime. The colored fills help visually track strength; sharp changes in MFI crossing 80/20 or 90/10 zones often precede pullbacks or reversals. Use the plotted circles as optional take-profit signals when MFI and trend are extended. Adjust AlphaTrail length/multiplier and MFI smoothing to better match the asset’s volatility profile.

Elliott Wave Noise FilterElliott Wave Noise Filter
Overview
The Elliott Wave Noise Filter is a specialized indicator for TradingView, designed to solve one of the biggest challenges in Elliott Wave analysis on lower timeframes: the identification of market noise. By combining multiple advanced filtering techniques, this indicator helps distinguish meaningful price action from random fluctuations.
The Problem
On lower timeframes—especially below 15 minutes—Elliott Wave analysis is significantly impacted by excessive market noise. This noise can lead to misinterpretation of wave structures, making it difficult to execute reliable trading decisions.
The Solution
The Elliott Wave Noise Filter utilizes four powerful methods to detect and filter noise:
ATR-Based Volatility Analysis: Identifies price movements too small to be structurally meaningful
Volume Confirmation: Filters out price moves that occur with insufficient volume
Trend Strength Measurement (ADX): Detects periods of weak trend activity, where noise tends to dominate
Fractal Pattern Recognition: Marks significant turning points that could be relevant for Elliott Wave analysis
Features
Visual Indicators
Background Coloring: Red indicates noise; green signifies a clear signal
Hull Moving Average: Smooths price action and highlights the prevailing trend
Fractal Markers: Triangles mark significant highs and lows
Status Panel: Displays current noise status and ADX value
Customization Options
ATR Period: Adjust the lookback period for ATR calculations
Noise Threshold: Defines the percentage of ATR below which a movement is considered noise
Volume Filter: Can be enabled or disabled
Volume Threshold: Sets the ratio to average volume for a move to be deemed significant
Hull MA Display and Length: Configure the moving average settings
ADX Parameters: Adjust trend strength sensitivity
Use Cases
For Elliott Wave Analysis
Eliminate noise to identify cleaner wave structures
Use fractal markers as potential wave endpoints
Reference the Hull MA for determining the broader trend
For General Trading
Identify high-noise periods to avoid low-quality setups
Spot clearer market phases for better entries
Assess price action quality through visual cues
Multi-Timeframe Approach
Apply the indicator across different timeframes for a comprehensive view
Prefer trading when both higher and lower timeframes align with consistent signals
Optimal Settings
For Very Short Timeframes (1–5 minutes)
Higher Noise Threshold (0.4–0.5)
Longer ATR Period (20–30)
Higher Volume Threshold (1.0–1.2)
For Medium Timeframes (15–60 minutes)
Medium Noise Threshold (0.2–0.3)
Standard ATR Period (14)
Standard Volume Threshold (0.8)
For Higher Timeframes (4h and above)
Lower Noise Threshold (0.1–0.2)
Shorter ATR Period (10)
Lower Volume Threshold (0.6–0.7)
Conclusion
The Elliott Wave Noise Filter is an essential tool for any Elliott Wave analyst or trader working on lower timeframes. By reducing noise and emphasizing significant market movements, it enables more precise analysis and potentially more profitable trading decisions.
Note: As with any technical indicator, the Elliott Wave Noise Filter should be used as part of a broader trading strategy and not as a standalone signal for trade execution.

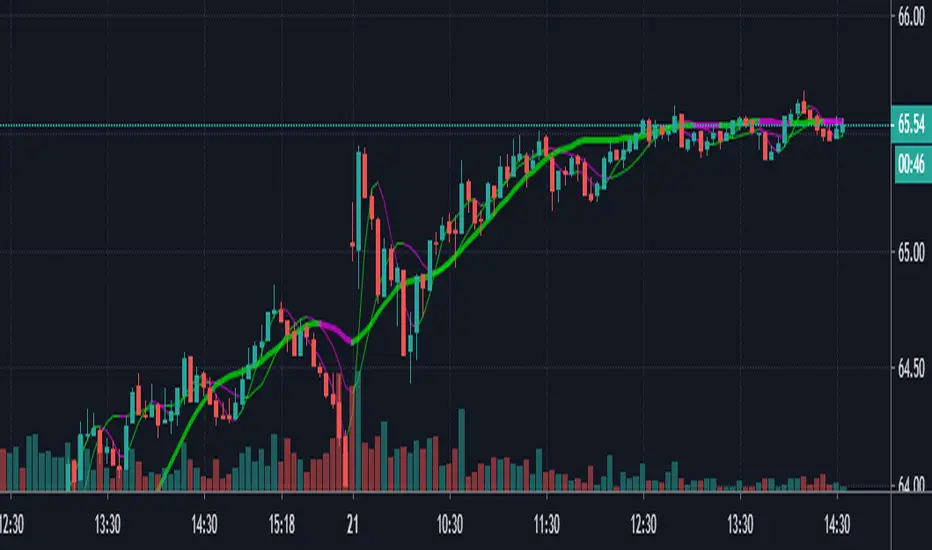
Hull Moving Average with Cloud📈 Hull Moving Average with Cloud – Adaptive Trend Visualization
This indicator combines the power of the Hull Moving Average (HMA) with a visual signal line and trend cloud, giving traders a clearer view of market direction, momentum shifts, and potential reversals.
🔍 Key Features:
Dynamic HMA Length (optional): Adjusts the HMA period based on ATR volatility, allowing the moving average to adapt to changing market conditions.
Custom Smoothing Options: Smooth the main HMA with your choice of SMA, EMA, or WMA for a tailored trend line.
Signal Line (Orange HMA): A shorter-period Hull MA that acts as a trigger line for crossovers and trend changes.
Color-Coded Trend Cloud:
🟩 Green Cloud: Bullish – main HMA is above the signal HMA.
🟥 Red Cloud: Bearish – main HMA is below the signal HMA.
Real-Time Trend Coloring: Both lines dynamically change color based on slope (green for rising, red/purple for falling).
Offset Capability: Shift the HMA forward to visualize trend development and potential future direction.
✅ Use Cases:
Identify trend direction with cloud coloration.
Spot early reversals through HMA crossover signals.
Filter trades with volatility-aware moving average responsiveness.

Smart QQE ModSmart QQE - Chart Overlay
Smart QQE shows QQE Trend and RSI plot on chart to determine the trend direction and eliminate false signals.
QQE is obtained from original code by Glaz and rescaled to fit on chart. RSI 50 level acts as Zero which is plotted as a Bollinger on chart.
This is not a Bollinger band . its an RSI channel with levels 0-100 plotted around the mid band. The RSI Mid Band is calculated based on RSI value.
Trend:
Price above RSI Mid band is uptrend
Price below RSI Mid band is Down Trend
The Green line - Discount Zone - 0-RSI level - Oversold Zone
The Red Line - Premium Zone - 100 - RSI level - Overbought Zone
Buy / Sell signals
QQE Buy and Sell signals are plotted based on crossovers of RSI and Fast RSI crossovers.
QQE trend is colored based on the crossover.
Candle color:
candle color determines the Original QQE Trend.
Blue - QQE line above Threshold level in Buy Zone
Pink - QQE line below Threshold level in Sell Zone
Entries are to be made with proper confirmation.
HULL MA is provided as a MA Ribbon for additional confirmation. This MA can be changed to various forms Like EMA , SMA , WMA , HMA , RMA the open and close of the MA are plotted so it determines the exact Trend reversal of the price.
Credits to @Glaz QQE Threshold

Triple Hull Moving AverageCalculates and plots 3 Hull Moving Averages. Color of plot changes to indicate positive or negative slope. Original Hull MA code written by mohamed982.
4 Hull MAThe Hull Moving Average (HMA) was developed by Alan Hull in 2005 for the purpose of reducing lag, increasing responsiveness while at the same time eliminating noise. Its calculation is elaborate and makes use of the Weighted Moving Average (WMA). It emphasizes recent prices over older ones, resulting in a fast-acting yet smooth moving average that can be used to identify the prevailing market trend. It can also be used for entry and exit signals. I have integrated 4 HMA's into one which can be used for taking entry and exits similar to 4 EMA strategies. All credit goes to Alan Hull for developing this technique.

Hull Moving Average Cloud v2Hull Moving Average Cloud, is not the normal Hull crossover, instead opens orders at cross of price and alternative Hull MA configuration (stretches/shrinks with momentum)
Has history settings, Commission already included in result. Only looks into past, should be no repaint (im sure the trolls will correct me if im wrong, thankyou trolls i can always count on you)
Source code open, if you find improvement please share thankyou

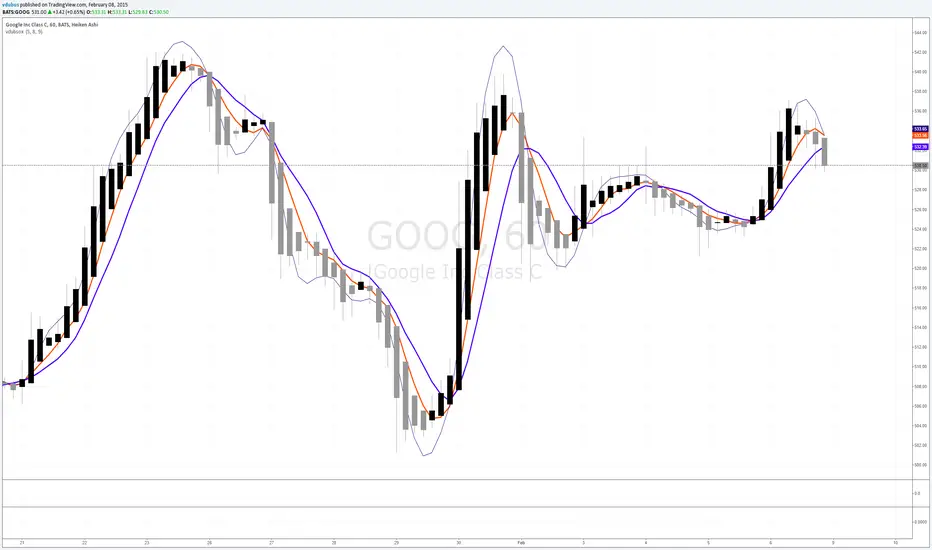
vdubsoxI've been asking for this concept for a while, a simple MA that rides the top side of the trend instead of the bottom, and by accident came across the 'Hull ma' on a TV blog post. I've added another two simple Moving averages to act as strength indicator with close proximity to the price.
The strategy is simple MA cross over but with the early indication using Hull ma gives you a heads up on trend / price reversal.
I'm using this in conjunction with BB set at 34. on a 1/3/5 min charts & Heiken Ashi to smooth out the noise with awesome success trading Binary options.