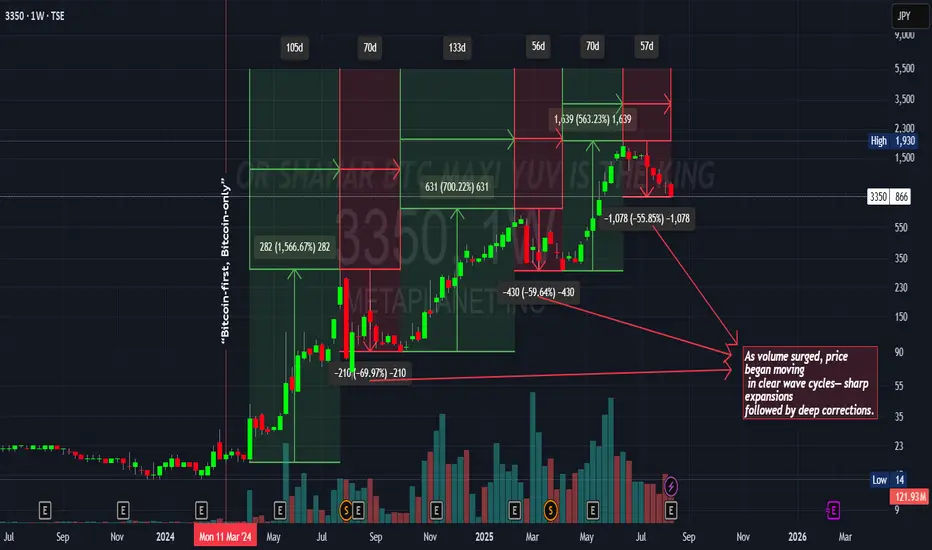
This chart highlights how price action developed in distinct wave cycles once volume surged.
Each expansion phase was sharp, delivering multi-hundred percent gains in relatively short periods.
These expansions were consistently followed by deep corrective pullbacks of 50–70%.
The repeating rhythm shows a market structure of accumulation → expansion → correction → continuation.
Overall, the cycles emphasize the importance of recognizing both momentum opportunities and the inevitable retracements that followed.
Отказ от ответственности
Все виды контента, которые вы можете увидеть на TradingView, не являются финансовыми, инвестиционными, торговыми или любыми другими рекомендациями. Мы не предоставляем советы по покупке и продаже активов. Подробнее — в Условиях использования TradingView.
Отказ от ответственности
Все виды контента, которые вы можете увидеть на TradingView, не являются финансовыми, инвестиционными, торговыми или любыми другими рекомендациями. Мы не предоставляем советы по покупке и продаже активов. Подробнее — в Условиях использования TradingView.