Three Step Future-Trend [BigBeluga]Three Step Future-Trend by BigBeluga is a forward-looking trend analysis tool designed to project potential future price direction based on historical periods. This indicator aggregates data from three consecutive periods, using price averages and delta volume analysis to forecast trend movement and visualize it on the chart with a projected trend line and volume metrics.
🔵 Key Features:
Three Period Analysis: Calculates price averages and delta volumes from three specified periods, creating a consolidated view of historical price movement.
Future Trend Line Projection: Plots a forward trend line based on the calculated averag of three periods, helping traders visualize potential future price movement.
Avg Delta Volume and Future Price Label: Shows a delta average Volume a long with a Future Price label at the end of the projected trend line, indicating the possible future delta volume and future Price.
Volume Data Table: Displays a detailed table showing delta and total volume for each of the three periods, allowing quick volume comparison to support the projected trend.
This indicator provides a dynamic way to anticipate market direction by blending price and volume data, giving traders insights into both volume and trend strength in upcoming periods.
Индикаторы и стратегии

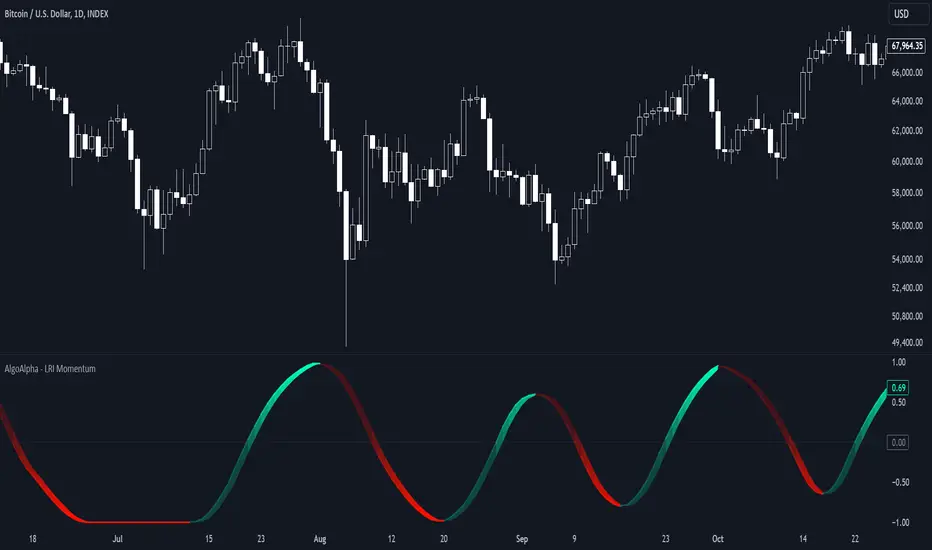
LRI Momentum Cycles [AlgoAlpha]Discover the LRI Momentum Cycles indicator by AlgoAlpha, a cutting-edge tool designed to identify market momentum shifts using trend normalization and linear regression analysis. This advanced indicator helps traders detect bullish and bearish cycles with enhanced accuracy, making it ideal for swing traders and intraday enthusiasts alike.
Key Features :
🎨 Customizable Appearance : Set personalized colors for bullish and bearish trends to match your charting style.
🔧 Dynamic Trend Analysis : Tracks market momentum using a unique trend normalization algorithm.
📊 Linear Regression Insight : Calculates real-time trend direction using linear regression for better precision.
🔔 Alert Notifications : Receive alerts when the market switches from bearish to bullish or vice versa.
How to Use :
🛠 Add the Indicator : Favorite and apply the indicator to your TradingView chart. Adjust the lookback period, linear regression source, and regression length to fit your strategy.
📊 Market Analysis : Watch for color changes on the trend line. Green signals bullish momentum, while red indicates bearish cycles. Use these shifts to time entries and exits.
🔔 Set Alerts : Enable notifications for momentum shifts, ensuring you never miss critical market moves.
How It Works :
The LRI Momentum Cycles indicator calculates trend direction by applying linear regression on a user-defined price source over a specified period. It compares historical trend values, detecting bullish or bearish momentum through a dynamic scoring system. This score is normalized to ensure consistent readings, regardless of market conditions. The indicator visually represents trends using gradient-colored plots and fills to highlight changes in momentum. Alerts trigger when the momentum state changes, providing actionable trading signals.
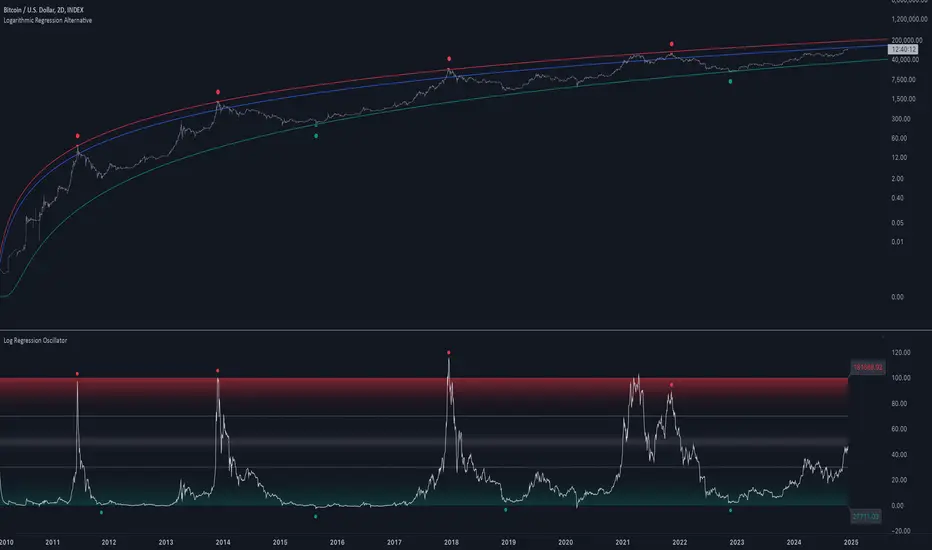
Log Regression OscillatorThe Log Regression Oscillator transforms the logarithmic regression curves into an easy-to-interpret oscillator that displays potential cycle tops/bottoms.
🔶 USAGE
Calculating the logarithmic regression of long-term swings can help show future tops/bottoms. The relationship between previous swing points is calculated and projected further. The calculated levels are directly associated with swing points, which means every swing point will change the calculation. Importantly, all levels will be updated through all bars when a new swing is detected.
The "Log Regression Oscillator" transforms the calculated levels, where the top level is regarded as 100 and the bottom level as 0. The price values are displayed in between and calculated as a ratio between the top and bottom, resulting in a clear view of where the price is situated.
The main picture contains the Logarithmic Regression Alternative on the chart to compare with this published script.
Included are the levels 30 and 70. In the example of Bitcoin, previous cycles showed a similar pattern: the bullish parabolic was halfway when the oscillator passed the 30-level, and the top was very near when passing the 70-level.
🔹 Proactive
A "Proactive" option is included, which ensures immediate calculations of tentative unconfirmed swings.
Instead of waiting 300 bars for confirmation, the "Proactive" mode will display a gray-white dot (not confirmed swing) and add the unconfirmed Swing value to the calculation.
The above example shows that the "Calculated Values" of the potential future top and bottom are adjusted, including the provisional swing.
When the swing is confirmed, the calculations are again adjusted, showing a red dot (confirmed top swing) or a green dot (confirmed bottom swing).
🔹 Dashboard
When less than two swings are available (top/bottom), this will be shown in the dashboard.
The user can lower the "Threshold" value or switch to a lower timeframe.
🔹 Notes
Logarithmic regression is typically used to model situations where growth or decay accelerates rapidly at first and then slows over time, meaning some symbols/tickers will fit better than others.
Since the logarithmic regression depends on swing values, each new value will change the calculation. A well-fitted model could not fit anymore in the future.
Users have to check the validity of swings; for example, if the direction of swings is downwards, then the dataset is not fitted for logarithmic regression.
In the example above, the "Threshold" is lowered. However, the calculated levels are unreliable due to the swings, which do not fit the model well.
Here, the combination of downward bottom swings and price accelerates slower at first and faster recently, resulting in a non-fit for the logarithmic regression model.
Note the price value (white line) is bound to a limit of 150 (upwards) and -150 (down)
In short, logarithmic regression is best used when there are enough tops/bottoms, and all tops are around 100, and all bottoms around 0.
Also, note that this indicator has been developed for a daily (or higher) timeframe chart.
🔶 DETAILS
In mathematics, the dot product or scalar product is an algebraic operation that takes two equal-length sequences of numbers (arrays) and returns a single number, the sum of the products of the corresponding entries of the two sequences of numbers.
The usual way is to loop through both arrays and sum the products.
In this case, the two arrays are transformed into a matrix, wherein in one matrix, a single column is filled with the first array values, and in the second matrix, a single row is filled with the second array values.
After this, the function matrix.mult() returns a new matrix resulting from the product between the matrices m1 and m2.
Then, the matrix.eigenvalues() function transforms this matrix into an array, where the array.sum() function finally returns the sum of the array's elements, which is the dot product.
dot(x, y)=>
if x.size() > 1 and y.size() > 1
m1 = matrix.new()
m2 = matrix.new()
m1.add_col(m1.columns(), y)
m2.add_row(m2.rows (), x)
m1.mult (m2)
.eigenvalues()
.sum()
🔶 SETTINGS
Threshold: Period used for the swing detection, with higher values returning longer-term Swing Levels.
Proactive: Tentative Swings are included with this setting enabled.
Style: Color Settings
Dashboard: Toggle, "Location" and "Text Size"
Loacally Weighted MA (LWMA) Direction HistogramThe Locally Weighted Moving Average (LWMA) Direction Histogram indicator is designed to provide traders with a visual representation of the price momentum and trend direction. This Pine Script, written in version 6, calculates an LWMA by assigning higher weights to recent data points, emphasizing the most current market movements. The script incorporates user-defined input parameters, such as the LWMA length and a direction lookback period, making it flexible to adapt to various trading strategies and preferences.
The histogram visually represents the difference between the current LWMA and a previous LWMA value (based on the lookback period). Positive values are colored blue, indicating upward momentum, while negative values are yellow, signaling downward movement. Additionally, the script colors candlesticks according to the histogram's value, enhancing clarity for users analyzing market trends. The LWMA line itself is plotted on the chart but hidden by default, enabling traders to toggle its visibility as needed. This blend of histogram and candlestick visualization offers a comprehensive tool for identifying shifts in momentum and potential trading opportunities.

[blackcat] L1 Swing Reversal Oscillator█ OVERVIEW
The script defines a custom indicator called the "L1 Swing Reversal Oscillator," which integrates moving averages and RSI to detect possible swing reversals in market trends. Its core purpose is to produce signals derived from the oscillator's indications of overbought or oversold states.
█ LOGICAL FRAMEWORK
The script comprises multiple key segments:
1 — Custom Functions: Encompasses calculate_weighted_moving_average and calculate_l1_swing_reversal_oscillator.
2 — Input Parameters: Permits customization of moving average lengths and weights alongside RSI settings.
3 — Calculations: Employs predefined functions to determine oscillator readings.
4 — Plot Statements: Depicts oscillator outputs graphically on the chart.
Data processing follows this sequence: initial computation of the typical price, subsequent derivation of the adjusted CC1 metric, additional smoothing operations, and finally, RSI evaluation prior to plotting the resultant oscillator figures.
█ CUSTOM FUNCTIONS
• calculate_weighted_moving_average(source, length, weight) : Generates a weighted moving average from the provided source material utilizing specified duration and coefficient inputs.
– Returns computed weighted moving average.
• calculate_l1_swing_reversal_oscillator(close_price, high_price, low_price, sma_length, sma_weight, rsi_length) : Assesses the L1 Swing Reversal Oscillator leveraging closing, highest, and lowest prices along with defined SMA span, weighting factor, and RSI period.
– Yields an array featuring central CC1, CB1, CB2, and RSI metrics.
█ KEY POINTS AND TECHNIQUES
• Weighted Moving Average: Incorporates bespoke functionality for computing weighted moving averages, distinct from built-in Pine Script methods.
• RSI Calculation: Employs customized logic for calculating Relative Strength Index, offering adaptable computational approaches.
• Plotting Techniques: Implements color coding contingent upon oscillator values to emphasize visual cues regarding overbought and oversold statuses.
• Optimization: Furnishes adjustable parameters including SMA timeframe, weightage, and RSI interval enabling personalized fine-tuning per user requirements.
█ EXTENDED KNOWLEDGE AND APPLICATIONS
• Modifications: Potential enhancements involve integrating supplementary oscillators like MACD or Stochastic Oscillator alongside the existing L1 Swing Reversal Oscillator.
• Application Scenarios: Comparable methodologies can be adopted within various trading frameworks focusing on momentum shifts such as trend-following or mean reversion tactics.
• Related Concepts: Proficiency in crafting custom functions, manipulating moving averages, and interpreting RSI within Pine Script environment proves advantageous when altering or expanding on current script functionalities. Understanding utilization of nz and na functions for managing null data points adds significant depth.

SUHAIL Trend Levels [BigBeluga]+ percent trendthis indicator is the best indicator and all market works great working. money flow

GainzAlgo Pro// © GainzAlgo
//@version=5
indicator('GainzAlgo Pro', overlay=true, max_labels_count=500)
candle_stability_index_param = input.float(0.5, 'Candle Stability Index', 0, 1, step=0.1, group='Technical', tooltip='Candle Stability Index measures the ratio between the body and the wicks of a candle. Higher - more stable.')
rsi_index_param = input.int(50, 'RSI Index', 0, 100, group='Technical', tooltip='RSI Index measures how overbought/oversold is the market. Higher - more overbought/oversold.')
candle_delta_length_param = input.int(5, 'Candle Delta Length', 3, group='Technical', tooltip='Candle Delta Length measures the period over how many candles the price increased/decreased. Higher - longer period.')
disable_repeating_signals_param = input.bool(true, 'Disable Repeating Signals', group='Technical', tooltip='Removes repeating signals. Useful for removing clusters of signals and general clarity')
GREEN = color.rgb(29, 255, 40)
RED = color.rgb(255, 0, 0)
TRANSPARENT = color.rgb(0, 0, 0, 100)
label_size = input.string('normal', 'Label Size', options= , group='Cosmetic')
label_style = input.string('text bubble', 'Label Style', , group='Cosmetic')
buy_label_color = input(GREEN, 'BUY Label Color', inline='Highlight', group='Cosmetic')
sell_label_color = input(RED, 'SELL Label Color', inline='Highlight', group='Cosmetic')
label_text_color = input(color.white, 'Label Text Color', inline='Highlight', group='Cosmetic')
stable_candle = math.abs(close - open) / ta.tr > candle_stability_index_param
rsi = ta.rsi(close, 14)
bullish_engulfing = close < open and close > open and close > open
rsi_below = rsi < rsi_index_param
decrease_over = close < close
bull = bullish_engulfing and stable_candle and rsi_below and decrease_over and barstate.isconfirmed
bearish_engulfing = close > open and close < open and close < open
rsi_above = rsi > 100 - rsi_index_param
increase_over = close > close
bear = bearish_engulfing and stable_candle and rsi_above and increase_over and barstate.isconfirmed
var last_signal = ''
if bull and (disable_repeating_signals_param ? (last_signal != 'buy' ? true : na) : true)
if label_style == 'text bubble'
label.new(bull ? bar_index : na, low, 'BUY', color=buy_label_color, style=label.style_label_up, textcolor=label_text_color, size=label_size)
else if label_style == 'triangle'
label.new(bull ? bar_index : na, low, 'BUY', yloc=yloc.belowbar, color=buy_label_color, style=label.style_triangleup, textcolor=TRANSPARENT, size=label_size)
else if label_style == 'arrow'
label.new(bull ? bar_index : na, low, 'BUY', yloc=yloc.belowbar, color=buy_label_color, style=label.style_arrowup, textcolor=TRANSPARENT, size=label_size)
last_signal := 'buy'
if bear and (disable_repeating_signals_param ? (last_signal != 'sell' ? true : na) : true)
if label_style == 'text bubble'
label.new(bear ? bar_index : na, high, 'SELL', color=sell_label_color, style=label.style_label_down, textcolor=label_text_color, size=label_size)
else if label_style == 'triangle'
label.new(bear ? bar_index : na, high, 'SELL', yloc=yloc.abovebar, color=sell_label_color, style=label.style_triangledown, textcolor=TRANSPARENT, size=label_size)
else if label_style == 'arrow'
label.new(bear ? bar_index : na, high, 'SELL', yloc=yloc.abovebar, color=sell_label_color, style=label.style_arrowdown, textcolor=TRANSPARENT, size=label_size)
last_signal := 'sell'
alertcondition(bull, 'BUY Signals', 'New signal: BUY')
alertcondition(bear, 'SELL Signals', 'New signal: SELL')

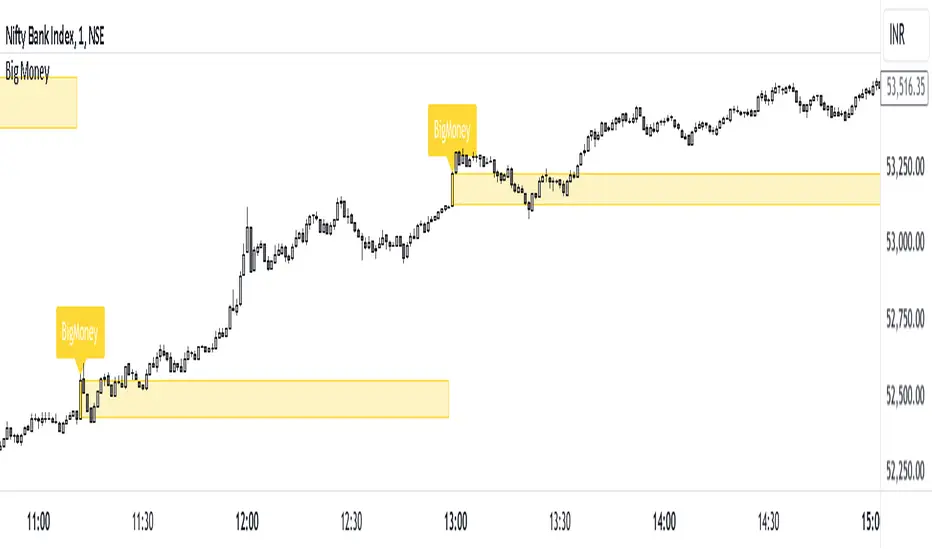
Big Money by ChartedhighsBig Money by Chartedhighs
Script Overview:
The "Big Money" indicator is designed to help traders easily identify significant price movements on their charts. This script visually highlights candles where the price change from open to close exceeds a user-defined threshold. It draws attention to these key moments, providing a clear indication of potential big-money moves in the market.
Key Features:
Customizable Threshold:
Allows users to set a specific price change threshold via the input menu (Highlight Threshold).
Only candles with a price change greater than or equal to this value are highlighted.
Candle Highlighting:
Uses color-coded bars to emphasize candles meeting the threshold condition.
Candles are highlighted in yellow for immediate visual clarity.
Dynamic Box Annotation:
Draws a semi-transparent yellow box around highlighted candles.
Extends the box dynamically to subsequent bars, providing an area of interest for continued analysis.
Labeling for Key Moments:
Automatically adds a label ("BigMoney") above highlighted bars to further indicate significant price action.
How It Works:
The script calculates the price change for each bar (close - open) and compares it to the user-defined threshold.
If the price change meets or exceeds the threshold:
The bar color changes to yellow.
A box is drawn around the candle to highlight the price movement visually.
A label is added above the candle to emphasize its significance.
The box extends dynamically until the next highlighted candle, allowing users to track zones of activity.
Customization Options:
Highlight Threshold: Modify the threshold value to suit your trading style or instrument volatility.
Use Case:
This indicator is ideal for traders looking to identify significant price movements quickly. It helps to locate areas where "big money" might be flowing into the market, offering potential entry or exit opportunities.
How to Use:
Add the "Big Money by Chartedhighs" script to your TradingView chart.
Set the Highlight Threshold to a value suitable for your market or timeframe.
Observe highlighted candles and boxes for potential trading signals or areas of interest.
This script is highly visual, intuitive, and customizable, making it a great addition to any trader's toolkit!
MicuRobert EMA Cross StrategyThis is a repost of a old strategy that cant be updated anymore, it was a request for a user made in Oct, 6, 2015
Here's a possible engaging description for the tradingview script:
**MicuRobert EMA Cross V2: A Powerful Trading Strategy**
Join the ranks of successful traders with this advanced strategy, designed to help you profit from market trends. The MicuRobert EMA Cross V2 combines two essential indicators - Exponential Moving Average (EMA) and Divergence EMA (DEMA) - to generate buy and sell signals.
**Key Features:**
* **Trading Session Filter**: Only trade during your preferred session, ensuring you're in sync with market conditions.
* **Trailing Stop**: Automatically adjust stop-loss levels to lock in profits or limit losses.
* **Customizable Trade Size**: Set the size of each trade based on your risk tolerance and trading goals.
**How it Works:**
The script uses two EMAs (5-period and 34-period) to identify trends. When the shorter EMA crosses above the longer one, a buy signal is generated. Conversely, when the shorter EMA falls below the longer one, a sell signal is triggered. The strategy also incorporates divergence analysis between price action and the EMAs.
**Visual Aids:**
* **EMA Plots**: Visualize the two EMAs on your chart to gauge market momentum.
* **Buy/Sell Signals**: See when buy or sell signals are generated, along with their corresponding entry prices.
* **Trailing Stop Lines**: Monitor stop-loss levels as they adjust based on price action.
**Get Started:**
Download this script and start trading like a pro! With its robust features and customizable settings, the MicuRobert EMA Cross V2 is an excellent addition to any trader's arsenal.
~Llama3
EZ Trend IndicatorMade this to help me not be a bozo and to stick to the trend
I like taking the labels off
cheers

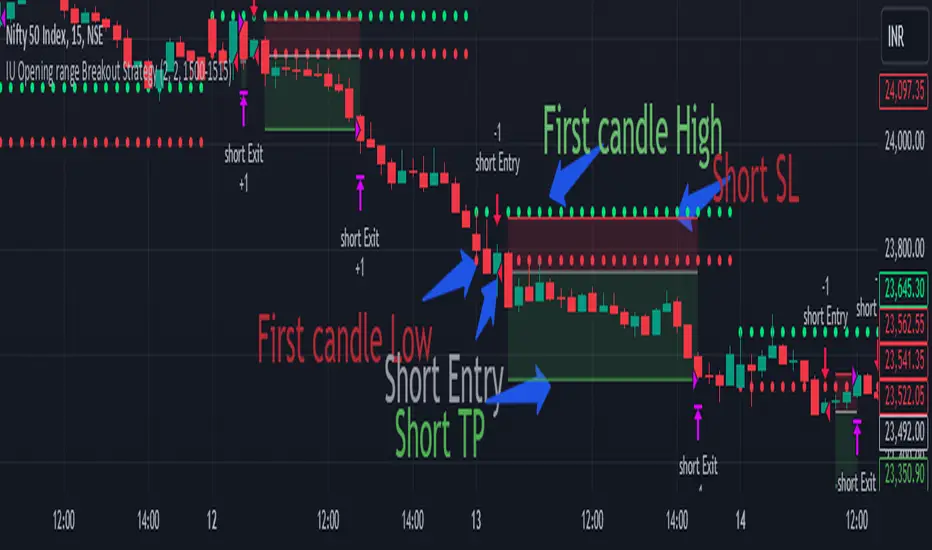
IU Opening range Breakout StrategyIU Opening Range Breakout Strategy
This Pine Script strategy is designed to capitalize on the breakout of the opening range, which is a popular trading approach. The strategy identifies the high and low prices of the opening session and takes trades based on price crossing these levels, with built-in risk management and trade limits for intraday trading.
Key Features:
1. Risk Management:
- Risk-to-Reward Ratio (RTR):
Set a customizable risk-to-reward ratio to calculate target prices based on stop-loss levels.
Default: 2:1
- Max Trades in a Day:
Specify the maximum number of trades allowed per day to avoid overtrading.
Default: 2 trades in a day.
- End-of-Day Close:
Automatically closes all open positions at a user-defined session end time to ensure no overnight exposure.
Default: 3:15 PM
2. Opening Range Identification
- Opening Range High and Low:
The script detects the high and low of the first trading session using Pine Script's session functions.
These levels are plotted as visual guides on the chart:
- High: Lime-colored circles.
- Low: Red-colored circles.
3. Trade Entry Logic
- Long Entry:
A long trade is triggered when the price closes above the opening range high.
- Entry condition: Crossover of the price above the opening range high.
-Short Entry:
A short trade is triggered when the price closes below the opening range low.
- Entry condition: Crossunder of the price below the opening range low.
Both entries are conditional on the absence of an existing position.
4. Stop Loss and Take Profit
- Long Position:
- Stop Loss: Previous candle's low.
- Take Profit: Calculated based on the RTR.
- **Short Position:**
- **Stop Loss:** Previous candle's high.
- **Take Profit:** Calculated based on the RTR.
The strategy plots these levels for visual reference:
- Stop Loss: Red dashed lines.
- Take Profit: Green dashed lines.
5. Visual Enhancements
-Trade Level Highlighting:
The script dynamically shades the areas between the entry price and SL/TP levels:
- Red shading for the stop-loss region.
- Green shading for the take-profit region.
- Entry Price Line:
A silver-colored line marks the average entry price for active trades.
How to Use:
1.Input Configuration:
Adjust the Risk-to-Reward ratio, max trades per day, and session end time to suit your trading preferences.
2.Visual Cues:
Use the opening range high/low lines and shading to identify potential breakout opportunities.
3.Execution:
The strategy will automatically enter and exit trades based on the conditions. Review the plotted SL and TP levels to monitor the risk-reward setup.
Important Notes:
- This strategy is designed for intraday trading and works best in markets with high volatility during the opening session.
- Backtest the strategy on your preferred market and timeframe to ensure compatibility.
- Proper risk management and position sizing are essential when using this strategy in live markets.

Zero-Lag MA CandlesThe Zero-Lag MA Candles indicator combines the efficiency of a Zero-Lag Moving Average (ZLMA) with dynamic candlestick coloring to provide a clear visual representation of market trends. By leveraging a dual EMA-based calculation, the ZLMA achieves reduced lag, enhancing its responsiveness to price changes. The indicator plots candles on the chart with colors determined by the trend direction of the ZLMA over a user-defined lookback period. Blue candles signify an uptrend, while yellow candles indicate a downtrend, offering traders an intuitive way to identify market sentiment.
This indicator is particularly useful for trend-following strategies, as the crossover and crossunder between the ZLMA and the standard EMA highlight potential reversal points or trend continuation zones. With customizable inputs for ZLMA length, trend lookback period, and color schemes, it caters to diverse trading preferences. Its ability to plot directly on the chart ensures seamless integration with other analysis tools, making it a valuable addition to a trader's toolkit.
Happy trading...
Support and Resistance LinesDraw the last 5 support and resistance lines. It works on the current timeframe. You can adjust the sensibility by changing the diff variable.

Kernel Regression Envelope with SMI OscillatorThis script combines kernel regression, envelope calculations, and the Stochastic Momentum Index (SMI) to generate trading signals. It uses a Nadaraya-Watson estimator with a Rational Quadratic kernel to model price trends, constructs an envelope around the estimated trend using Average True Range (ATR), and utilizes the SMI to identify potential overbought/oversold conditions for entry and exit points.
Strategy Logic:
Kernel Regression:
The script employs the Nadaraya-Watson estimator, a non-parametric regression technique, to estimate the underlying trend of the price.
It utilizes the Rational Quadratic kernel function, which allows for flexible weighting of past data points based on their distance in time.
The h parameter controls the lookback window (number of bars used for estimation), alpha determines the relative weighting of time frames, and x_0 sets the starting bar for regression.
Envelope Calculation:
An envelope is created around the estimated trend (yhat_close) to define potential support and resistance levels.
The envelope's boundaries are calculated using a multiple of the ATR, which measures market volatility.
nearFactor and farFactor control the width of the envelope, creating near and far boundaries.
Smoothing:
The script includes an option to smooth the SMA output using various moving average types (SMA, EMA, SMMA, WMA, VWMA).
This smoothing helps to filter out noise and provide a clearer trend signal.
Stochastic Momentum Index (SMI):
The SMI is used as a momentum oscillator to identify potential overbought and oversold conditions.
It measures the distance of the current close relative to the midpoint of the high-low range over a specified period.
Crossovers between the SMI and its EMA signal potential trend reversals.
Entry and Exit Conditions:
Long Entry: A long position is entered when the smoothing line is below the lower far boundary of the envelope, the SMI crosses above its EMA, and the SMI is below -50 (indicating oversold conditions).
Short Entry: A short position is entered when the smoothing line is above the upper far boundary of the envelope, the SMI crosses below its EMA, and the SMI is above 50 (indicating overbought conditions).
Long Exit: A long position is closed when the price crosses above the upper far boundary.
Short Exit: A short position is closed when the price crosses below the lower far boundary.
Stop Loss: A stop loss is set at a user-defined number of ticks below the entry price for long positions and above the entry price for short positions.
Customization:
The script offers extensive customization options, including:
Kernel parameters (lookback window, relative weighting, starting bar)
Envelope parameters (ATR length, near/far factors)
Smoothing method and length
SMI parameters (lengths for %K, %D, and EMA)
Timeframe for SMI calculation
Colors for plots and fills
Stop loss level
Disclaimer:
This script is for educational purposes and should not be considered financial advice. Backtesting and thorough analysis are recommended before using this strategy in live trading. The effectiveness of the strategy may vary depending on market conditions and the chosen parameters.

Multi Timeframe Candle/Retracement (MTCR)This script provides a visual representation of candlestick and pivot point information from higher timeframes within a lower timeframe chart. It is ideal for traders looking to analyze price movements and identify potential support and resistance zones in the context of a broader timeframe.
Key Features :
Multi-Timeframe Candlestick Visualization:
Displays candlesticks of the selected higher timeframe.
Highlights bullish and bearish candles with distinct colors to identify trends.
Pivot Point Analysis:
Calculates and visualizes pivot points based on the standard or Fibonacci model.
Supports customizable step sizes (rounding pivot values).
Highlights resistance levels (R1, R2, R3), support zones (S1, S2, S3), and a central base line.
Medians and High/Low Zones:
Visualizes median lines between pivot levels.
Optionally displays high and low zones.
Dynamic Updates:
Automatically updates lines and boxes with new candles or pivot calculations.
Visually marks when the current price touches key levels.
Settings :
Timeframe Selection:
Choose a higher timeframe for candlestick and pivot point visualization.
Customizable Colors:
Adjust colors for bullish and bearish candles, as well as for pivot point zones.
Flexible Display Options:
Display only the desired elements, such as pivot lines, median lines, high/low zones, or the base line.
Use Cases :
Identify key support and resistance zones using pivot points.
Analyze price movements on higher timeframes while trading on lower ones.
Utilize median lines to find potential reversal zones or areas for risk/reward analysis.
Notes :
This script is designed for advanced users with a solid understanding of multi-timeframe analysis and pivot points.
It uses multiple drawing objects (lines, boxes), so ensure your chart does not hit its drawing object limit.
Good luck with your trading! 🚀

Algorithmic Signal AnalyzerMeet Algorithmic Signal Analyzer (ASA) v1: A revolutionary tool that ushers in a new era of clarity and precision for both short-term and long-term market analysis, elevating your strategies to the next level.
ASA is an advanced TradingView indicator designed to filter out noise and enhance signal detection using mathematical models. By processing price movements within defined standard deviation ranges, ASA produces a smoothed analysis based on a Weighted Moving Average (WMA). The Volatility Filter ensures that only relevant price data is retained, removing outliers and improving analytical accuracy.
While ASA provides significant analytical advantages, it’s essential to understand its capabilities in both short-term and long-term use cases. For short-term trading, ASA excels at capturing swift opportunities by highlighting immediate trend changes. Conversely, in long-term trading, it reveals the overall direction of market trends, enabling traders to align their strategies with prevailing conditions.
Despite these benefits, traders must remember that ASA is not designed for precise trade execution systems where accuracy in timing and price levels is critical. Its focus is on analysis rather than order management. The distinction is crucial: ASA helps interpret price action effectively but may not account for real-time market factors such as slippage or execution delays.
Features and Functionality
ASA integrates multiple tools to enhance its analytical capabilities:
Customizable Moving Averages: SMA, EMA, and WMA options allow users to tailor the indicator to their trading style.
Signal Detection: Identifies bullish and bearish trends using the Relative Exponential Moving Average (REMA) and marks potential buy/sell opportunities.
Visual Aids: Color-coded trend lines (green for upward, red for downward) simplify interpretation.
Alert System: Notifications for trend swings and reversals enable timely decision-making.
Notes on Usage
ASA’s effectiveness depends on the context in which it is applied. Traders should carefully consider the trade-offs between analysis and execution.
Results may vary depending on market conditions and chart types. Backtesting with ASA on standard charts provides more reliable insights compared to non-standard chart types.
Short-term use focuses on rapid trend recognition, while long-term application emphasizes understanding broader market movements.
Takeaways
ASA is not a tool for precise trade execution but a powerful aid for interpreting price trends.
For short-term trading, ASA identifies quick opportunities, while for long-term strategies, it highlights trend directions.
Understanding ASA’s limitations and strengths is key to maximizing its utility.
ASA is a robust solution for traders seeking to filter noise, enhance analytical clarity, and align their strategies with market movements, whether for short bursts of activity or sustained trading goals.

DemaRSI StrategyThis is a repost to a old script that cant be updated anymore, the request was made on Feb, 27, 2016.
Here's a engaging description for the tradingview script:
**DemaRSI Strategy: A Proven Trading System**
Join thousands of traders who have already experienced the power of this highly effective strategy. The DemaRSI system combines two powerful indicators - DEMA (Double Exponential Moving Average) and RSI (Relative Strength Index) - to generate profitable trades with minimal risk.
**Key Features:**
* **Trend-Following**: Our algorithm identifies strong trends using a combination of DEMA and RSI, allowing you to ride the waves of market momentum.
* **Risk Management**: The system includes built-in stop-loss and take-profit levels, ensuring that your gains are protected and losses are minimized.
* **Session-Based Trading**: Trade during specific sessions only (e.g., London or New York) for even more targeted results.
* **Customizable Settings**: Adjust the length of moving averages, RSI periods, and other parameters to suit your trading style.
**What You'll Get:**
* A comprehensive strategy that can be used with any broker or platform
* Easy-to-use interface with customizable settings
* Real-time performance metrics and backtesting capabilities
**Start Trading Like a Pro Today!**
This script is designed for intermediate to advanced traders who want to take their trading game to the next level. With its robust risk management features, this strategy can help you achieve consistent profits in various market conditions.
**Disclaimer:** This script is not intended as investment advice and should be used at your own discretion. Trading carries inherent risks, and losses are possible.
~Llama3

6 EMAs + SR ChannelsJust added 4 EMAs in the already available SR Channel indicator by LonesomeTheBlue.

Price Volume TrendlineThe Price Volume Trendline indicator calculates and displays a linear regression trendline based on the product of volume and price (e.g., Volume * Close, Volume * Open, etc.) for a specified timeframe. The indicator helps visualize the relationship between price and volume movements over time.
Note - Please choose a timeframe to display the trendline.
Key Features:
Linear Regression: The trendline is computed using a linear regression of Volume * Price values over a user-defined length (length_trend), providing a smoothed representation of the trend.
Color Coding: The trendline color changes dynamically:
Green: When the slope of the trendline is positive (indicating an uptrend in Volume * Price).
Red: When the slope of the trendline is negative (indicating a downtrend in Volume * Price).
Customizable Timeframe: Users can choose the timeframe for the Volume * Price calculation (either "auto" for the chart's timeframe or a custom timeframe).
This indicator is useful for identifying long-term trends in the relationship between price and volume, highlighting bullish or bearish conditions based on both price and volume dynamics.
Please feel free to share your feedback. That would be appreciated!

Katalyst's Opening Range BreakoutKatalyst's Opening Range Breakout + No Trade Zone
📜 Overview:
This indicator allows traders to visualize the high and low of the opening range for a user-selected timeframe (e.g., 30s, 1m, 5m, 15m). It features fully customizable lines, labels, and an optional **No Trade Zone** fill to help you identify breakout levels with ease.
---
🎯 Key Features:
1. **Customizable Opening Range**:
- Select your preferred opening range duration: **30 seconds, 1 minute, 2 minutes, 5 minutes, 10 minutes, or 15 minutes**.
- The indicator calculates and plots the **high** and **low** of the selected opening range.
2. **Dynamic Line Styling**:
- Choose the **line color**, **transparency**, and **style**: **Solid, Dashed, or Dotted**.
- Lines extend to the right of the chart for clarity.
3. **No Trade Zone** *(Optional / Disabled by default)*:
- When enabled, fills the area between the high and low lines with a customizable **color and transparency**.
- Helps visually identify consolidation areas where trading might be avoided.
4. **Labels for Precision**:
- Clearly displays the **Opening Range High** and **Low** values.
- Labels are color-coded and positioned dynamically for easy interpretation.
5. **Clean and Efficient Updates**:
- The indicator deletes old lines, labels, and fills before creating new ones, ensuring a clutter-free chart.
---
⚙️ How to Use:
1. **Select Your Timeframe**:
- From the settings, choose your desired opening range duration: 30s, 1m, 2m, 5m, 10m, or 15m.
2. **Customize the Visuals**:
- Adjust line color, style, and transparency.
- Enable the **No Trade Zone** for a transparent background fill between the high and low lines.
3. **Interpret the Breakout**:
- Watch for price movements above or below the **opening range** to identify potential breakout opportunities.
---
🛠 Settings:
Opening Range Duration: Select the timeframe for the opening range (30s, 1m, 2m, 5m, 10m, 15m).
Line Color: Set the color of the range lines.
Line Transparency: Adjust the transparency of the lines (0 = solid, 100 = invisible).
Line Style: Choose line style: Solid, Dashed, or Dotted.
Label Colors: Customize the label colors for the high and low values.
Enable No Trade Zone: Fill the area between high and low lines with a transparent color.
No Trade Zone Color: Set the fill color for the no trade zone.
No Trade Zone Transparency: Adjust the transparency of the no trade zone fill.
---
📈 Ideal For
Day traders and scalpers looking to trade **breakouts**.
Traders who want to identify areas of consolidation visually.
Anyone who relies on the **opening range** for their trading strategy.
---
🔍 Example Usage:
Set the opening range to **5 minutes** and enable the **No Trade Zone** with a light red fill.
Watch for price to break above or below the high/low lines to signal potential trade opportunities.
---
✨ Why Use This Indicator?
This script simplifies your breakout strategy by providing a clear, visually appealing representation of the opening range. The flexible customization options and the optional **No Trade Zone** make it a powerful tool for identifying high-probability trades.
---
Let me know if you need any additional tweaks or clarifications for this description. It's all set to help traders understand and use your powerful script! 🚀📈

Multi TimeFrame OHLC Overlay @MaxMaseratiMulti TimeFrame OHLC Overlay @MaxMaserati
A powerful and versatile indicator that displays OHLC (Open, High, Low, Close) data across multiple timeframes with enhanced visualization features. Perfect for traders who need to analyze price action across different time periods simultaneously.
Key Features:
Customizable multi-timeframe OHLC visualization with box and line overlays
Extended OHLC lines from higher timeframes with clear labeling
Distinct bullish and bearish candle representations
Fully configurable color schemes and display options
Real-time timeframe information display
Main Components:
Multi-Timeframe Display
Primary timeframe OHLC visualization with boxes and lines
Extended timeframe overlay for broader market context
Clear visual distinction between timeframes
Customizable Visuals
Separate color settings for bullish and bearish patterns
Adjustable transparency for both body and wick components
Configurable OHLC line colors and visibility
Extended Lines Features
Higher timeframe OHLC level overlay
Custom labels with timeframe identification
Adjustable line properties and visibility
Information Display
Current timeframe indicator
Extended timeframe reference
Clean and unobtrusive interface
Settings Groups:
Extended OHLC Lines
Labels Options
Display Options
Bullish/Bearish Candle Settings
OHLC Lines Configuration
Usage Tips:
Start with the default 240-minute timeframe or adjust to your preferred interval
Use the extended lines feature to view higher timeframe levels
Customize colors and transparency to match your chart theme
Enable/disable specific components based on your analysis needs
Perfect For:
Multi-timeframe analysis
Support/Resistance identification
Price action trading
Trend following strategies
Market structure analysis
This indicator combines powerful multi-timeframe analysis capabilities with clean visualization, making it an essential tool for traders who need to maintain awareness of price action across different time periods.
Note:
For optimal performance, adjust the visual settings according to your chart's timeframe and color scheme. The indicator is designed to work seamlessly across all trading instruments and timeframes.

Price action|By Murat|Market Structure Break - Order Block - Breaker Block - Mitigation Block - ZigZag
