Key Intraday Support & Resistance Levels (1-Day Timeframe)
Here’s a breakdown of the technical levels for ABFRL on a daily (1-day) timeframe:
Pivot Points & Fibonacci Levels (TopStockResearch as of Sept 5, 2025)
Standard daily pivots:
Support: S1 = ₹83.59, S2 = ₹81.59, S3 = ₹80.29, S4 = ₹78.29
Pivot: ₹84.89
Resistance: R1 = ₹86.89, R2 = ₹88.19
Camarilla pivots confirming nearby support/resistance zone
MunafaSutra Intraday Levels
One source reports:
Resistance: ₹78.09
Short-term support/resistance: ₹80.24 / ₹76.48
Another indicates:
Resistance: ₹77.42
Support/resistance: ₹78.26 / ₹75.82
These shorter-term numbers appear based on earlier data and may have shifted slightly. The pivot-based levels from TopStockResearch are likely more up-to-date and relevant for today’s intraday outlook.
Fibonacci Retracement Levels (from recent uptrends)
Retracement (support) zones from trend beginnings (e.g., June 13–Sept 4):
Near support areas: ₹79.85, ₹78.07, ₹76.30, ₹74.10
Projection (resistance) levels: ₹86.43, ₹88.63, ₹90.40, ₹92.18, ₹94.38
Gap Resistance & Candlestick Patterns
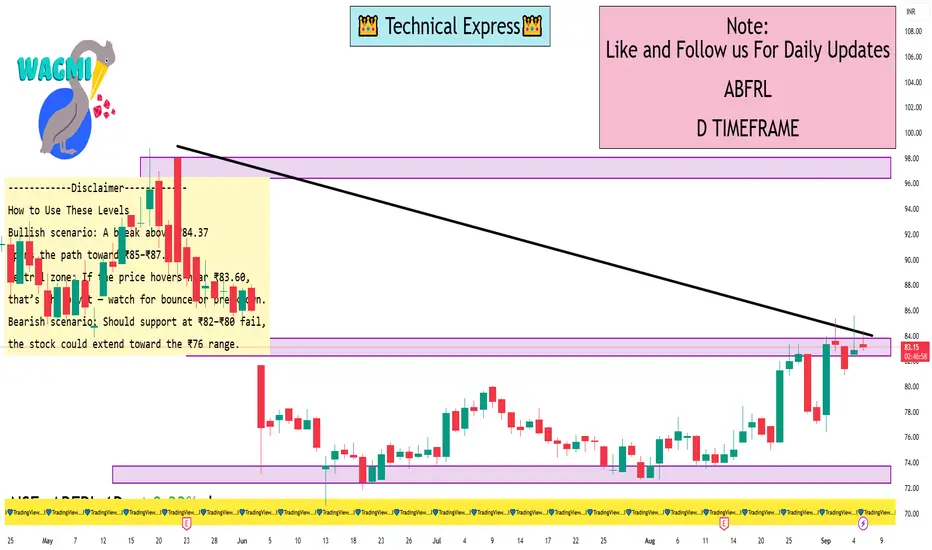
A gap resistance zone exists around ₹84, which may act as a near-term target if bullish momentum continues. Recent candlestick activity (inverted hammer, bullish pin bar) hints at potential short-term reversal strength
Here’s a breakdown of the technical levels for ABFRL on a daily (1-day) timeframe:
Pivot Points & Fibonacci Levels (TopStockResearch as of Sept 5, 2025)
Standard daily pivots:
Support: S1 = ₹83.59, S2 = ₹81.59, S3 = ₹80.29, S4 = ₹78.29
Pivot: ₹84.89
Resistance: R1 = ₹86.89, R2 = ₹88.19
Camarilla pivots confirming nearby support/resistance zone
MunafaSutra Intraday Levels
One source reports:
Resistance: ₹78.09
Short-term support/resistance: ₹80.24 / ₹76.48
Another indicates:
Resistance: ₹77.42
Support/resistance: ₹78.26 / ₹75.82
These shorter-term numbers appear based on earlier data and may have shifted slightly. The pivot-based levels from TopStockResearch are likely more up-to-date and relevant for today’s intraday outlook.
Fibonacci Retracement Levels (from recent uptrends)
Retracement (support) zones from trend beginnings (e.g., June 13–Sept 4):
Near support areas: ₹79.85, ₹78.07, ₹76.30, ₹74.10
Projection (resistance) levels: ₹86.43, ₹88.63, ₹90.40, ₹92.18, ₹94.38
Gap Resistance & Candlestick Patterns
A gap resistance zone exists around ₹84, which may act as a near-term target if bullish momentum continues. Recent candlestick activity (inverted hammer, bullish pin bar) hints at potential short-term reversal strength
I built a Buy & Sell Signal Indicator with 85% accuracy.
📈 Get access via DM or
WhatsApp: wa.link/d997q0
Contact - +91 76782 40962
| Email: techncialexpress@gmail.com
| Script Coder | Trader | Investor | From India
📈 Get access via DM or
WhatsApp: wa.link/d997q0
Contact - +91 76782 40962
| Email: techncialexpress@gmail.com
| Script Coder | Trader | Investor | From India
Похожие публикации
Отказ от ответственности
Информация и публикации не предназначены для предоставления и не являются финансовыми, инвестиционными, торговыми или другими видами советов или рекомендаций, предоставленных или одобренных TradingView. Подробнее читайте в Условиях использования.