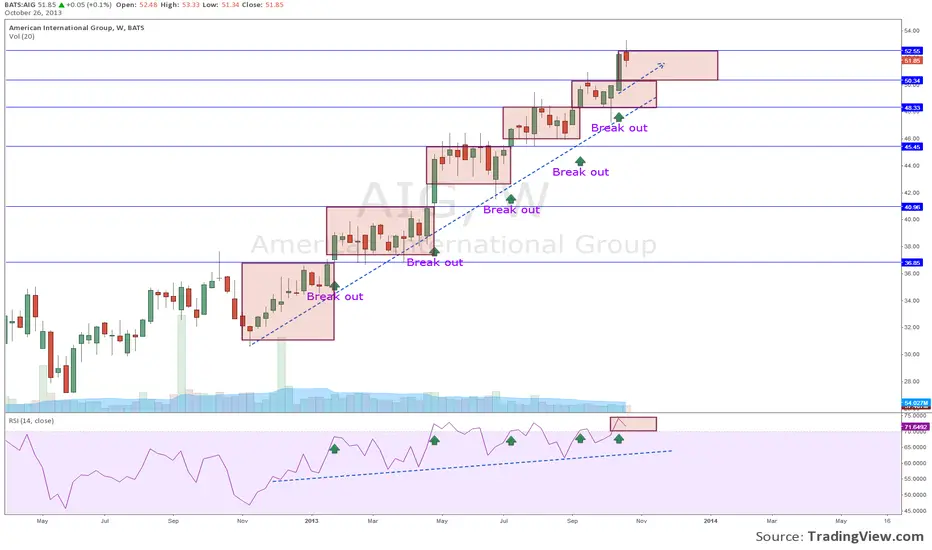
AIG long and strong on the weekly candle.
This is a continuation of a series of previous posted charts .
tradingview.com/v/LCD1fRMj/
tradingview.com/v/KLmqANDH/
tradingview.com/v/kAyKlDdn/
As show here, on weekly chart AIG now broke the resistance at $50.3, into the next zone of consolidation. I expect the RSI to drop a bit (to around 60-70s) before continuing the next leg up. The bullish trend is certainly up and strong.
Disclosure: No position in AIG at the time of analysis
Отказ от ответственности
Все виды контента, которые вы можете увидеть на TradingView, не являются финансовыми, инвестиционными, торговыми или любыми другими рекомендациями. Мы не предоставляем советы по покупке и продаже активов. Подробнее — в Условиях использования TradingView.
Отказ от ответственности
Все виды контента, которые вы можете увидеть на TradingView, не являются финансовыми, инвестиционными, торговыми или любыми другими рекомендациями. Мы не предоставляем советы по покупке и продаже активов. Подробнее — в Условиях использования TradingView.