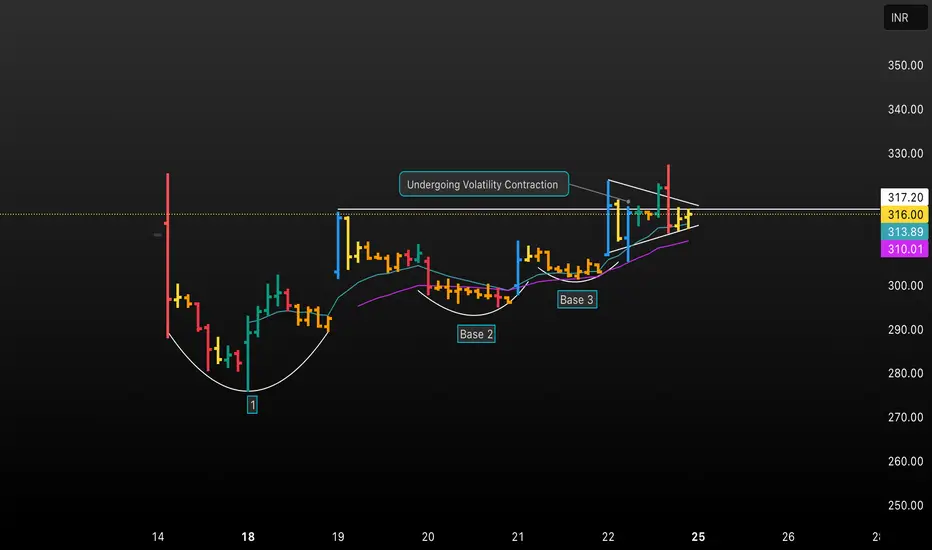
Unlock a detailed analysis of volatility contraction in this TradingView chart! Discover how price stabilizes through three distinct bases, undergoes steady consolidation, and prepares for a breakout. This educational chart highlights key phases, trendlines, and technical signals to help traders identify high-probability entry points using volatility contraction patterns. Ideal for those seeking actionable insights and trading strategy refinement.
Отказ от ответственности
Все виды контента, которые вы можете увидеть на TradingView, не являются финансовыми, инвестиционными, торговыми или любыми другими рекомендациями. Мы не предоставляем советы по покупке и продаже активов. Подробнее — в Условиях использования TradingView.
Отказ от ответственности
Все виды контента, которые вы можете увидеть на TradingView, не являются финансовыми, инвестиционными, торговыми или любыми другими рекомендациями. Мы не предоставляем советы по покупке и продаже активов. Подробнее — в Условиях использования TradingView.