📊 Intraday Technical Levels (1-Day Time Frame)
Based on pivot point analysis and Fibonacci retracements, here are the key support and resistance levels for today:
🔹 Standard Pivot Points
Support Levels: S1: ₹709.93, S2: ₹693.88, S3: ₹683.92
Resistance Levels: R1: ₹725.98, R2: ₹732.07
🔹 Camarilla Pivot Points
Support Levels: S3: ₹701.64, S2: ₹703.11, S1: ₹704.58
Resistance Levels: R1: ₹707.52, R2: ₹708.99, R3: ₹710.46
🔹 Fibonacci Retracement Levels
Support Levels: S1: ₹700.01, S2: ₹693.06
Resistance Levels: R1: ₹719.85, R2: ₹725.72
🔹 Woodie's Pivot Points
Support Levels: S1: ₹698.02, S2: ₹692.91
Resistance Levels: R1: ₹708.96, R2: ₹714.08
🔹 Demark Pivot Points
Support Levels: S1: ₹696.92
Resistance Levels: R1: ₹712.98
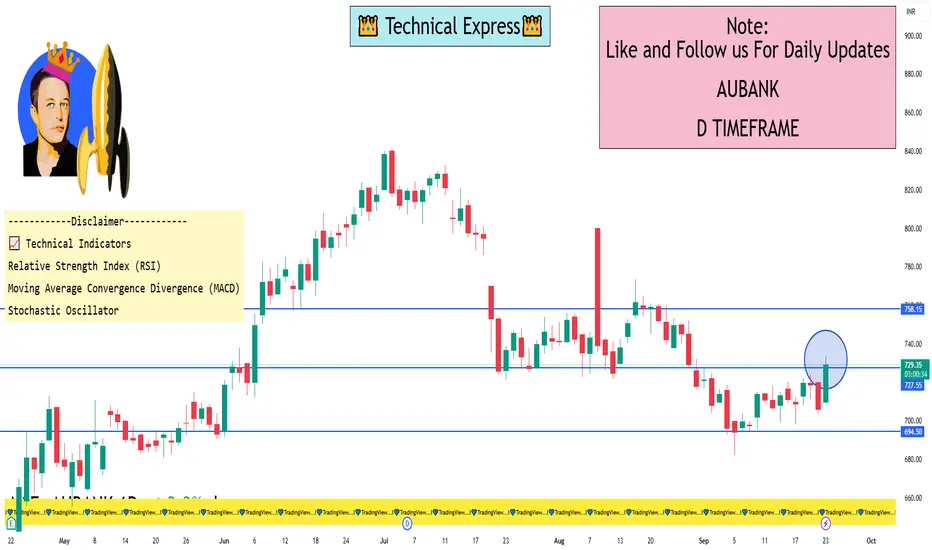
📈 Technical Indicators
Relative Strength Index (RSI): Currently at 60, indicating a bullish trend with room for further upside.
Moving Average Convergence Divergence (MACD): The MACD line is above the signal line, suggesting upward momentum.
Stochastic Oscillator: Reading between 55 and 80, indicating a bullish condition.
🔍 Summary
AU Small Finance Bank Ltd is exhibiting a bullish trend in the 1-day time frame, trading above key pivot levels. The RSI and MACD indicators support this positive outlook. Traders may consider monitoring the stock for potential breakout opportunities above resistance levels.
Based on pivot point analysis and Fibonacci retracements, here are the key support and resistance levels for today:
🔹 Standard Pivot Points
Support Levels: S1: ₹709.93, S2: ₹693.88, S3: ₹683.92
Resistance Levels: R1: ₹725.98, R2: ₹732.07
🔹 Camarilla Pivot Points
Support Levels: S3: ₹701.64, S2: ₹703.11, S1: ₹704.58
Resistance Levels: R1: ₹707.52, R2: ₹708.99, R3: ₹710.46
🔹 Fibonacci Retracement Levels
Support Levels: S1: ₹700.01, S2: ₹693.06
Resistance Levels: R1: ₹719.85, R2: ₹725.72
🔹 Woodie's Pivot Points
Support Levels: S1: ₹698.02, S2: ₹692.91
Resistance Levels: R1: ₹708.96, R2: ₹714.08
🔹 Demark Pivot Points
Support Levels: S1: ₹696.92
Resistance Levels: R1: ₹712.98
📈 Technical Indicators
Relative Strength Index (RSI): Currently at 60, indicating a bullish trend with room for further upside.
Moving Average Convergence Divergence (MACD): The MACD line is above the signal line, suggesting upward momentum.
Stochastic Oscillator: Reading between 55 and 80, indicating a bullish condition.
🔍 Summary
AU Small Finance Bank Ltd is exhibiting a bullish trend in the 1-day time frame, trading above key pivot levels. The RSI and MACD indicators support this positive outlook. Traders may consider monitoring the stock for potential breakout opportunities above resistance levels.
I built a Buy & Sell Signal Indicator with 85% accuracy.
📈 Get access via DM or
WhatsApp: wa.link/d997q0
| Email: techncialexpress@gmail.com
| Script Coder | Trader | Investor | From India
📈 Get access via DM or
WhatsApp: wa.link/d997q0
| Email: techncialexpress@gmail.com
| Script Coder | Trader | Investor | From India
Похожие публикации
Отказ от ответственности
Все виды контента, которые вы можете увидеть на TradingView, не являются финансовыми, инвестиционными, торговыми или любыми другими рекомендациями. Мы не предоставляем советы по покупке и продаже активов. Подробнее — в Условиях использования TradingView.