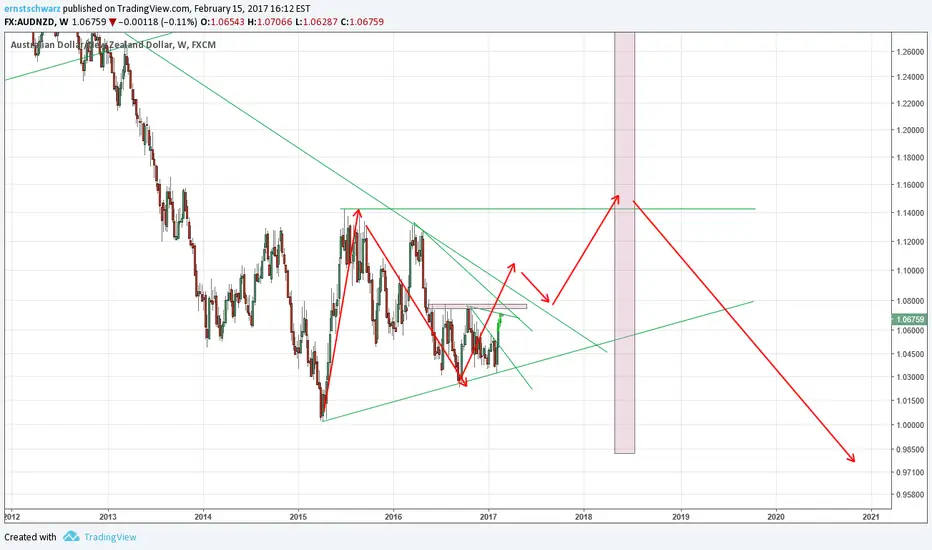
Let s assume a 3 wave corrective structure for more downside.
Easiest is to assume that the first high is taken and then downside.
I have a time prediction projected in the chart for a big change to come.
Let me know what you think.
Easiest is to assume that the first high is taken and then downside.
I have a time prediction projected in the chart for a big change to come.
Let me know what you think.
Заметка
Please keep in mind that this Chart / arrows in the chart represent an corrective structure in development.The first red up-arrow could be an impulse move to the upside and believing this would lead to a different expectation!
Заметка
Here is the same chart with additional alternative scenario (blue arrows, suggesting we are no longer in the bigger correction)Отказ от ответственности
Все виды контента, которые вы можете увидеть на TradingView, не являются финансовыми, инвестиционными, торговыми или любыми другими рекомендациями. Мы не предоставляем советы по покупке и продаже активов. Подробнее — в Условиях использования TradingView.
Отказ от ответственности
Все виды контента, которые вы можете увидеть на TradingView, не являются финансовыми, инвестиционными, торговыми или любыми другими рекомендациями. Мы не предоставляем советы по покупке и продаже активов. Подробнее — в Условиях использования TradingView.