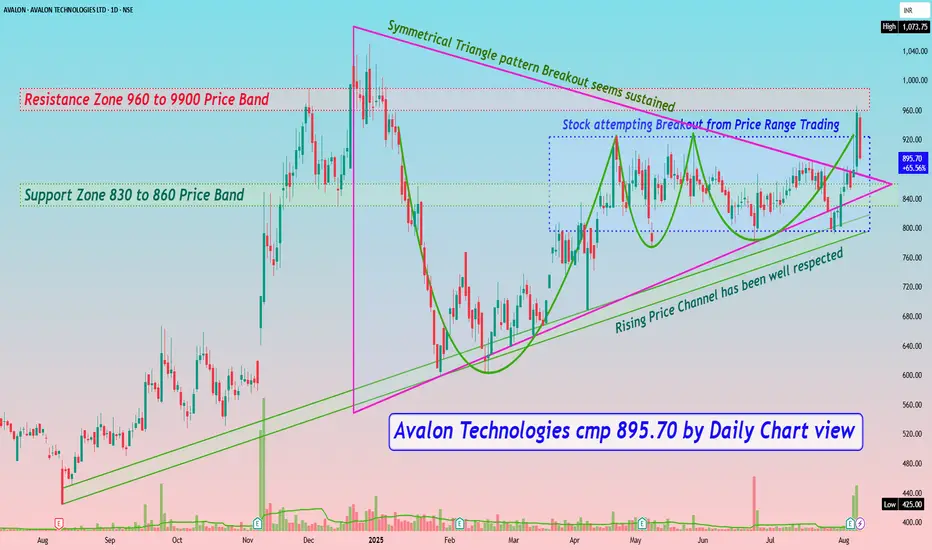
Avalon Technologies cmp 895.70 by Daily Chart view
- Support Zone 830 to 860 Price Band
- Resistance Zone 960 to 9900 Price Band
- Rising Price Channel has been well respected
- Stock attempting Breakout from Price Range Trading
- Symmetrical Triangle pattern Breakout seems sustained
- Repeated Bullish Rounding Bottoms under Resistance Zone neckline
- Volumes spiked heavily at end of week and above average traded quantity
- Positively trending Technical Indicators BB, EMA, MACD, RSI,SAR, SuperTrend
Заметка
Opps My bad, please read the Resistance Zone 960 to 990 Price Band, as one extra zero got typed twice.Отказ от ответственности
Все виды контента, которые вы можете увидеть на TradingView, не являются финансовыми, инвестиционными, торговыми или любыми другими рекомендациями. Мы не предоставляем советы по покупке и продаже активов. Подробнее — в Условиях использования TradingView.
Отказ от ответственности
Все виды контента, которые вы можете увидеть на TradingView, не являются финансовыми, инвестиционными, торговыми или любыми другими рекомендациями. Мы не предоставляем советы по покупке и продаже активов. Подробнее — в Условиях использования TradingView.