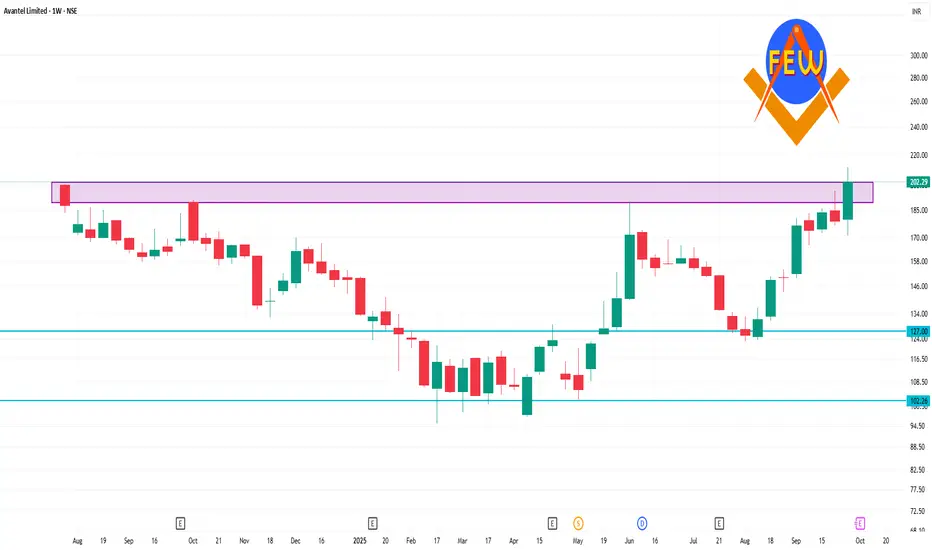
📈 Price Performance (1 Week)
Current Price: ₹202.29
Weekly Change: +11.61%
52-Week Range: ₹95.51 – ₹211.79
📊 Technical Indicators
Moving Averages
20-Day EMA: ₹173.47
50-Day EMA: ₹160.46
100-Day EMA: ₹151.62
200-Day EMA: ₹144.58
Current Price vs. EMAs: The current price is above all major EMAs, indicating a bullish trend.
Relative Strength Index (RSI)
14-Day RSI: 59.26
Interpretation: The RSI is in the neutral zone (50–70), suggesting neither overbought nor oversold conditions.
Moving Average Convergence Divergence (MACD)
MACD Value: 9.44
Signal: Positive MACD indicates upward momentum.
Stochastic RSI
Value: 53.95
Interpretation: Neutral, with no immediate overbought or oversold signals.
🔍 Summary
Trend: Bullish
Indicators: Most technical indicators are aligned with a positive outlook.
Resistance Levels: ₹211.79 (52-week high)
Support Levels: ₹173.47 (20-day EMA)
Похожие публикации
Отказ от ответственности
Все виды контента, которые вы можете увидеть на TradingView, не являются финансовыми, инвестиционными, торговыми или любыми другими рекомендациями. Мы не предоставляем советы по покупке и продаже активов. Подробнее — в Условиях использования TradingView.
Похожие публикации
Отказ от ответственности
Все виды контента, которые вы можете увидеть на TradingView, не являются финансовыми, инвестиционными, торговыми или любыми другими рекомендациями. Мы не предоставляем советы по покупке и продаже активов. Подробнее — в Условиях использования TradingView.