Avalanche (AVAX) technical analysis:
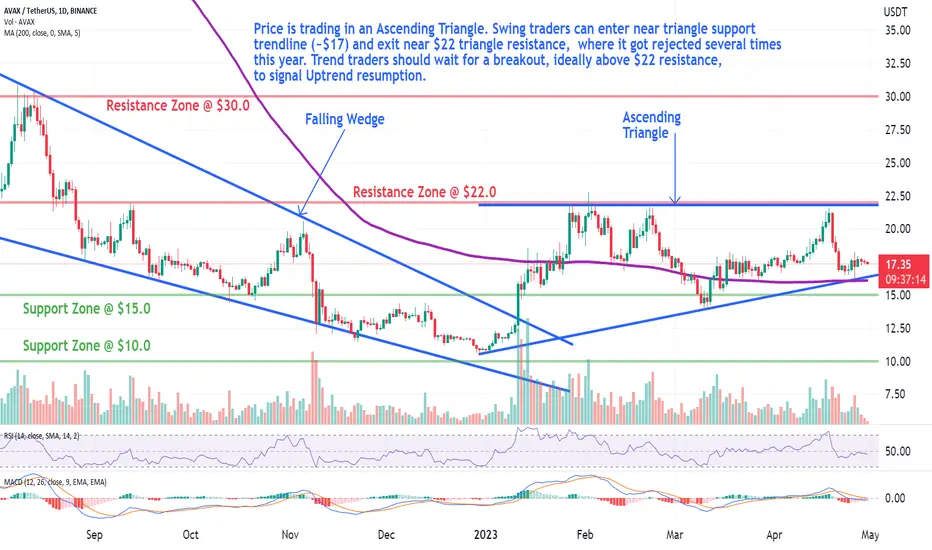
Trade setup: Price is trading in an Ascending Triangle. Swing traders can enter near triangle support trendline (~ 17) and exit near
  22 triangle resistance, where it got rejected several times this year. Trend traders should wait for a breakout, ideally above 22 resistance, to signal Uptrend resumption.
Trend: Downtrend on Short-Term basis, Neutral on Medium-Term basis and Uptrend on Long-Term basis.
Momentum is Mixed as MACD Line is below MACD Signal Line (Bearish) but RSI ~ 50 (Neutral). MACD Histogram bars are rising, which suggests that momentum could be nearing another upswing.
Support and Resistance: Nearest Support Zone is $15, (previous resistance), then $10. The nearest Resistance Zone is22, then $30.
Trade setup: Price is trading in an Ascending Triangle. Swing traders can enter near triangle support trendline (~
Trend: Downtrend on Short-Term basis, Neutral on Medium-Term basis and Uptrend on Long-Term basis.
Momentum is Mixed as MACD Line is below MACD Signal Line (Bearish) but RSI ~ 50 (Neutral). MACD Histogram bars are rising, which suggests that momentum could be nearing another upswing.
Support and Resistance: Nearest Support Zone is $15, (previous resistance), then $10. The nearest Resistance Zone is
Отказ от ответственности
Все виды контента, которые вы можете увидеть на TradingView, не являются финансовыми, инвестиционными, торговыми или любыми другими рекомендациями. Мы не предоставляем советы по покупке и продаже активов. Подробнее — в Условиях использования TradingView.
Отказ от ответственности
Все виды контента, которые вы можете увидеть на TradingView, не являются финансовыми, инвестиционными, торговыми или любыми другими рекомендациями. Мы не предоставляем советы по покупке и продаже активов. Подробнее — в Условиях использования TradingView.