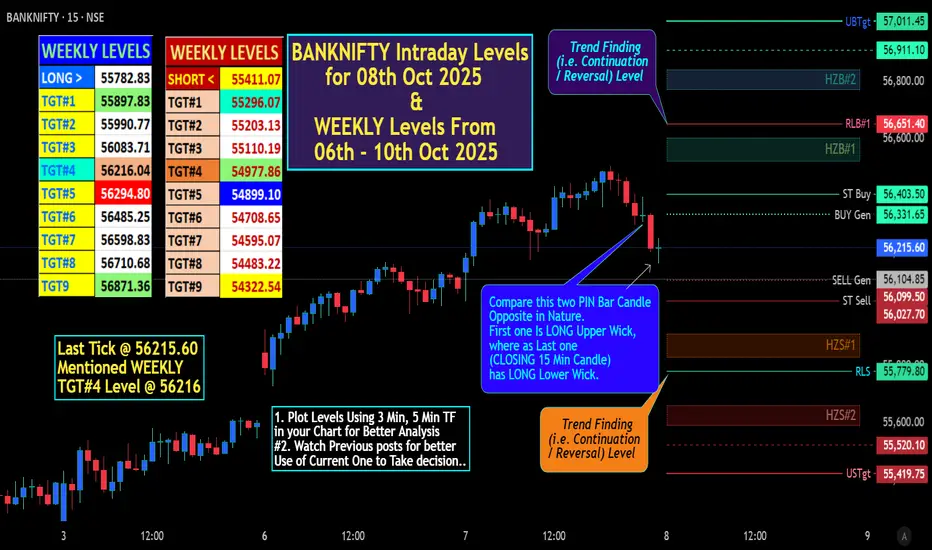
Last Tick @ 56215.60 Mentioned WEEKLY TGT#4 Level @ 56216
Compare this two PIN Bar Candle Opposite in Nature.
First one(Last 3rd 15 min Candle) Is LONG Upper Wick,
where as Last one (CLOSING 15 Min Candle) has LONG Lower Wick.
# "WEEKLY Levels" mentioned in BOX format.
^^^^^^^Plot Levels Using 3 Min, 5 Min Time frame in your Chart for Better Analysis^^^^^^^
L#1: If the candle crossed & stays above the “Buy Gen”, it is treated / considered as Bullish bias.
L#2: Possibility / Probability of REVERSAL near RLB#1 & UBTgt
L#3: If the candle stays above “Sell Gen” but below “Buy Gen”, it is treated / considered as Sidewise. Aggressive Traders can take Long position near “Sell Gen” either retesting or crossed from Below & vice-versa i.e. can take Short position near “Buy Gen” either retesting or crossed downward from Above.
L#4: If the candle crossed & stays below the “Sell Gen”, it is treated / considered a Bearish bias.
L#5: Possibility / Probability of REVERSAL near RLS#1 & USTgt
HZB (Buy side) & HZS (Sell side) => Hurdle Zone,
*** Specialty of “HZB#1, HZB#2 HZS#1 & HZS#2” is Sidewise (behaviour in Nature)
Rest Plotted and Mentioned on Chart
Color code Used:
Green =. Positive bias.
Red =. Negative bias.
RED in Between Green means Trend Finder / Momentum Change
/ CYCLE Change and Vice Versa.
Notice One thing: HOW LEVELS are Working.
Use any Momentum Indicator / Oscillatoror as you "USED to" to Take entry.
⚠️ DISCLAIMER:
The information, views, and ideas shared here are purely for educational and informational purposes only. They are not intended as investment advice or a recommendation to buy, sell, or hold any financial instruments. I am not a SEBI-registered financial adviser.
Trading and investing in the stock market involves risk, and you should do your own research and analysis. You are solely responsible for any decisions made based on this research.
"As HARD EARNED MONEY IS YOUR's, So DECISION SHOULD HAVE TO BE YOUR's".
Do comment if Helpful.
In depth Analysis will be added later
Сделка активна
Short Report on BANKNIFTY Intraday Outlook for October 8, 2025. (OWN VIEW)Technical Analysis
Candlestick Patterns & Indicators: Recent sessions (Oct 3-7) show bullish engulfing patterns with higher closes, indicating recovery momentum. Intraday charts from Oct 7 display an upward channel, with RSI at ~58 (bullish, not overbought), MACD positive crossover, and Inline with GOLDEN CROSSOVER (20-DMA Cross 50 DMA at ~55,130 providing support. Key levels: Support & Resistance Plotted & Mentioned on Chart. Rising wedge noted in short-term, but upward bias prevails.
Implied Volatility & Greeks: IV for near-ATM October options ~15-16% (moderate, per trends from NSE and analyst views). High OI at 56,200 CE and 56,000 PE suggests resistance overhead and support below. Delta ~0.5 for ATM, gamma favors quick upside moves.
Assumptions: Emphasizing bullish candle from Oct 7 close and Elliott Wave continuation upside, assuming hold above 56,000
Похожие публикации
Отказ от ответственности
Все виды контента, которые вы можете увидеть на TradingView, не являются финансовыми, инвестиционными, торговыми или любыми другими рекомендациями. Мы не предоставляем советы по покупке и продаже активов. Подробнее — в Условиях использования TradingView.
Похожие публикации
Отказ от ответственности
Все виды контента, которые вы можете увидеть на TradingView, не являются финансовыми, инвестиционными, торговыми или любыми другими рекомендациями. Мы не предоставляем советы по покупке и продаже активов. Подробнее — в Условиях использования TradingView.