Detailed Market Structure Breakdown
4-Hour Chart (Macro Trend)
Structure: The Bank Nifty is in a confirmed bullish bounce phase. The index has decisively broken out of the steep descending channel and closed strongly above the key 55,400 level. This action signals a powerful Break of Structure (BOS), establishing a new leg up from the 54,250 demand zone.
Key Levels:
Major Supply (Resistance): 55,800 - 56,000. This remains the key overhead supply zone from the September highs (Order Block).
Major Demand (Support): 54,250 - 54,400. This is the key reversal low. The immediate short-term support is 54,800 - 55,000.
Outlook: The medium-term bias has shifted to strongly bullish. The consolidation is complete, and the index is now targeting the 56,000 zone.
1-Hour Chart (Intermediate View)
Structure: The 1H chart shows a clear Break of Structure (BOS) on the upside, as the price broke the descending trendline and key horizontal resistance. The index is now trading within a clear ascending channel, making higher highs and higher lows.
Key Levels:
Immediate Resistance: 55,800.
Immediate Support: 55,400 - 55,500 (This area was a major point of contention and is now expected to act as support).
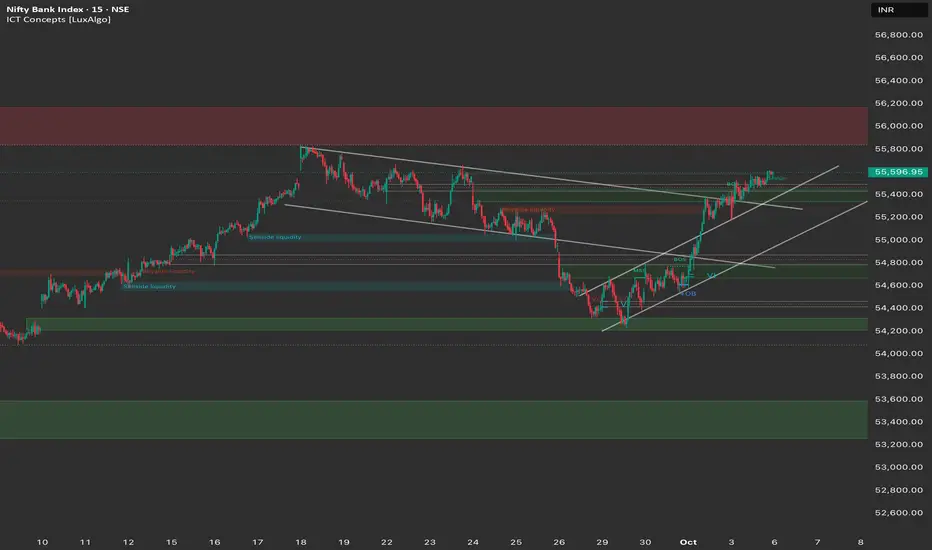
15-Minute Chart (Intraday View)
Structure: The 15M chart shows strong bullish momentum, with the price breaking out of a triangular consolidation pattern. The price has successfully reclaimed key liquidity levels and is poised for continuation.
Key Levels:
Intraday Supply: 55,800.
Intraday Demand: 55,400.
Outlook: Strongly Bullish.
📈 Trade Plan (Monday, 6th October)
Market Outlook: The Bank Nifty is in a powerful bullish phase, showing relative strength compared to Nifty. The primary strategy will be to buy on dips or buy on continuation.
Bullish Scenario (Primary Plan)
Justification: The confirmed reversal, breakout from the descending channel, and strong close near the day's high all point to a move toward the major supply zone.
Entry: Long entry on a decisive break and 15-minute candle close above 55,800. Alternatively, look for a dip entry near 55,400 (the recent breakout level).
Stop Loss (SL): Place a stop loss below 55,200 (below the immediate FVG/swing low).
Targets:
T1: 56,000 (Psychological resistance/Order Block).
T2: 56,200 (Extension target).
T3: 56,500 (Upper resistance).
Bearish Scenario (Counter-Trend Plan)
Justification: This high-risk, counter-trend plan only becomes valid if the rally fails dramatically at the open.
Trigger: A decisive break and 1-hour candle close below 55,100.
Entry: Short entry below 55,100.
Stop Loss (SL): Above 55,400.
Targets:
T1: 54,800 (Minor support/FVG).
T2: 54,400 (Key reversal support).
Key Levels for Observation:
Immediate Decision Point: 55,500 - 55,800 zone.
Bullish Confirmation: A break and sustained move above 55,800.
Bearish Warning: A move below 55,200 suggests a reversal failure and consolidation.
Line in the Sand: 55,000. Below this level, the short-term bias shifts back to neutral-to-bearish.
4-Hour Chart (Macro Trend)
Structure: The Bank Nifty is in a confirmed bullish bounce phase. The index has decisively broken out of the steep descending channel and closed strongly above the key 55,400 level. This action signals a powerful Break of Structure (BOS), establishing a new leg up from the 54,250 demand zone.
Key Levels:
Major Supply (Resistance): 55,800 - 56,000. This remains the key overhead supply zone from the September highs (Order Block).
Major Demand (Support): 54,250 - 54,400. This is the key reversal low. The immediate short-term support is 54,800 - 55,000.
Outlook: The medium-term bias has shifted to strongly bullish. The consolidation is complete, and the index is now targeting the 56,000 zone.
1-Hour Chart (Intermediate View)
Structure: The 1H chart shows a clear Break of Structure (BOS) on the upside, as the price broke the descending trendline and key horizontal resistance. The index is now trading within a clear ascending channel, making higher highs and higher lows.
Key Levels:
Immediate Resistance: 55,800.
Immediate Support: 55,400 - 55,500 (This area was a major point of contention and is now expected to act as support).
15-Minute Chart (Intraday View)
Structure: The 15M chart shows strong bullish momentum, with the price breaking out of a triangular consolidation pattern. The price has successfully reclaimed key liquidity levels and is poised for continuation.
Key Levels:
Intraday Supply: 55,800.
Intraday Demand: 55,400.
Outlook: Strongly Bullish.
📈 Trade Plan (Monday, 6th October)
Market Outlook: The Bank Nifty is in a powerful bullish phase, showing relative strength compared to Nifty. The primary strategy will be to buy on dips or buy on continuation.
Bullish Scenario (Primary Plan)
Justification: The confirmed reversal, breakout from the descending channel, and strong close near the day's high all point to a move toward the major supply zone.
Entry: Long entry on a decisive break and 15-minute candle close above 55,800. Alternatively, look for a dip entry near 55,400 (the recent breakout level).
Stop Loss (SL): Place a stop loss below 55,200 (below the immediate FVG/swing low).
Targets:
T1: 56,000 (Psychological resistance/Order Block).
T2: 56,200 (Extension target).
T3: 56,500 (Upper resistance).
Bearish Scenario (Counter-Trend Plan)
Justification: This high-risk, counter-trend plan only becomes valid if the rally fails dramatically at the open.
Trigger: A decisive break and 1-hour candle close below 55,100.
Entry: Short entry below 55,100.
Stop Loss (SL): Above 55,400.
Targets:
T1: 54,800 (Minor support/FVG).
T2: 54,400 (Key reversal support).
Key Levels for Observation:
Immediate Decision Point: 55,500 - 55,800 zone.
Bullish Confirmation: A break and sustained move above 55,800.
Bearish Warning: A move below 55,200 suggests a reversal failure and consolidation.
Line in the Sand: 55,000. Below this level, the short-term bias shifts back to neutral-to-bearish.
Отказ от ответственности
Все виды контента, которые вы можете увидеть на TradingView, не являются финансовыми, инвестиционными, торговыми или любыми другими рекомендациями. Мы не предоставляем советы по покупке и продаже активов. Подробнее — в Условиях использования TradingView.
Отказ от ответственности
Все виды контента, которые вы можете увидеть на TradingView, не являются финансовыми, инвестиционными, торговыми или любыми другими рекомендациями. Мы не предоставляем советы по покупке и продаже активов. Подробнее — в Условиях использования TradingView.