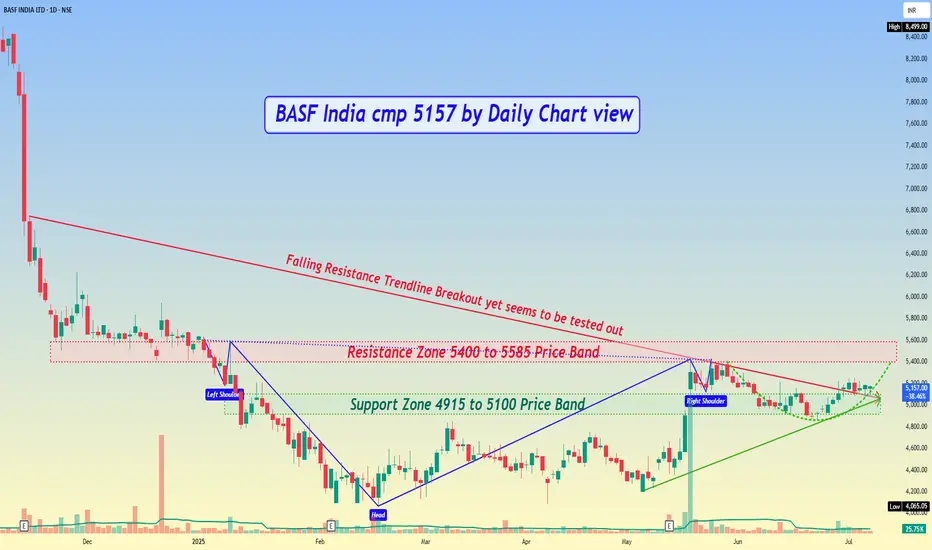
BASF India cmp 5157 by Daily Chart view
- Support Zone 4915 to 5100 Price Band
- Resistance Zone 5400 to 5585 Price Band
- Stock Price is in the process of Support Zone testing retesting
- Falling Resistance Trendline Breakout yet seems to be tested out
- Rising Support Trendline seems well respected and price well above it
- Bullish Head & Shoulder followed by a Rounding Bottom in completion stage
- Volumes seem to be on selling side, need to increase for fresh upside price movement
- Majority of the Technical Indicators seem to be turning positive for BB, EMA, MACD, RSI, SAR
Отказ от ответственности
Информация и публикации не предназначены для предоставления и не являются финансовыми, инвестиционными, торговыми или другими видами советов или рекомендаций, предоставленных или одобренных TradingView. Подробнее читайте в Условиях использования.
Отказ от ответственности
Информация и публикации не предназначены для предоставления и не являются финансовыми, инвестиционными, торговыми или другими видами советов или рекомендаций, предоставленных или одобренных TradingView. Подробнее читайте в Условиях использования.