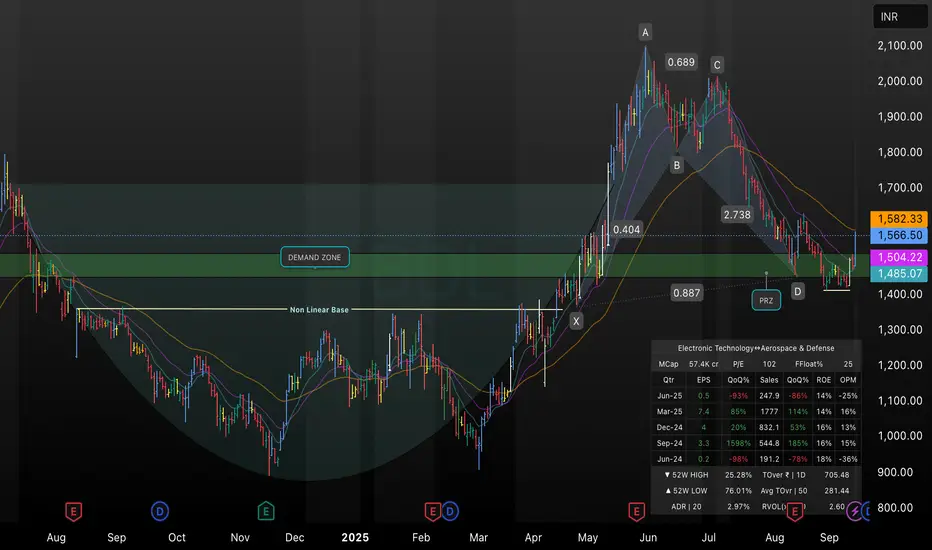
This daily chart of BDL highlights a completed bullish harmonic pattern converging with a strong demand zone between ₹1,480–₹1,510. The recent reversal from the Potential Reversal Zone (PRZ) and the overlap with the nonlinear base signal accumulation, while the confluence of 21/50 EMA suggests short-term support. Key resistance lies near ₹1,580; a break above may extend the upmove, while failure to hold ₹1,485 could invalidate the bullish setup. This chart is intended for educational and technical analysis purposes only.
Отказ от ответственности
Все виды контента, которые вы можете увидеть на TradingView, не являются финансовыми, инвестиционными, торговыми или любыми другими рекомендациями. Мы не предоставляем советы по покупке и продаже активов. Подробнее — в Условиях использования TradingView.
Отказ от ответственности
Все виды контента, которые вы можете увидеть на TradingView, не являются финансовыми, инвестиционными, торговыми или любыми другими рекомендациями. Мы не предоставляем советы по покупке и продаже активов. Подробнее — в Условиях использования TradingView.