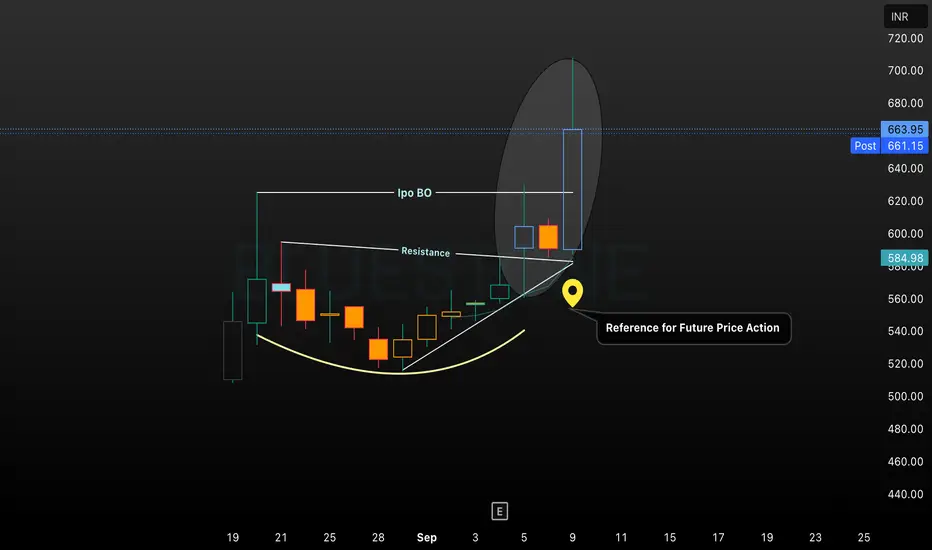
This chart analysis for Bluestone visualizes a bullish IPO breakout above resistance, confirmed by a rounded bottom base pattern and strong candle momentum. The highlighted reference marker identifies a crucial price level for monitoring future action, supporting technical study and trading decisions. Visual annotations emphasize breakout confirmation and the significance of post-breakout levels for trend continuation monitoring.
Отказ от ответственности
Все виды контента, которые вы можете увидеть на TradingView, не являются финансовыми, инвестиционными, торговыми или любыми другими рекомендациями. Мы не предоставляем советы по покупке и продаже активов. Подробнее — в Условиях использования TradingView.
Отказ от ответственности
Все виды контента, которые вы можете увидеть на TradingView, не являются финансовыми, инвестиционными, торговыми или любыми другими рекомендациями. Мы не предоставляем советы по покупке и продаже активов. Подробнее — в Условиях использования TradingView.