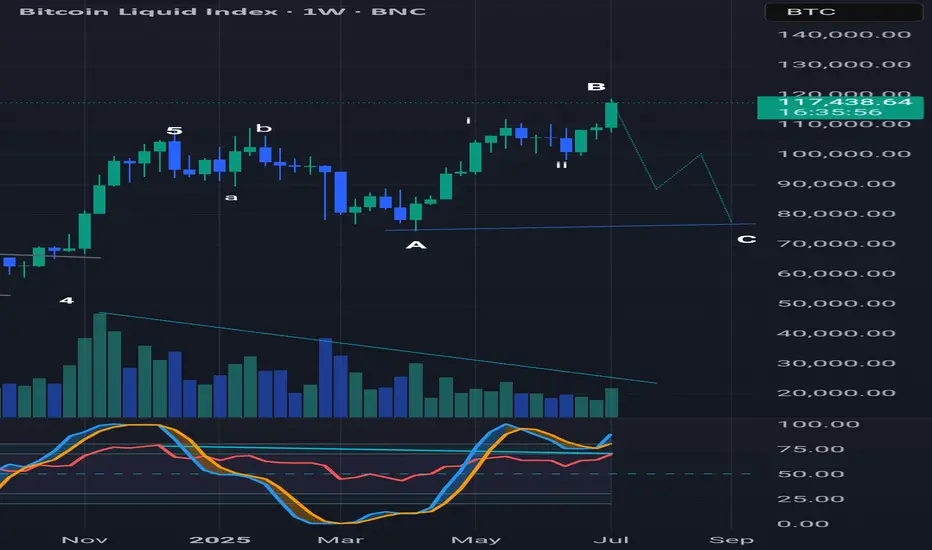
A running flat is where the B wave exceeds the starting point of wave A and the subsequent drop of wave C does not exceed the wave A low. Also note the declining volume and bearish divergence with the RSI on the weekly (and monthly) chart suggesting this move up is losing momentum.
Отказ от ответственности
Все виды контента, которые вы можете увидеть на TradingView, не являются финансовыми, инвестиционными, торговыми или любыми другими рекомендациями. Мы не предоставляем советы по покупке и продаже активов. Подробнее — в Условиях использования TradingView.
Отказ от ответственности
Все виды контента, которые вы можете увидеть на TradingView, не являются финансовыми, инвестиционными, торговыми или любыми другими рекомендациями. Мы не предоставляем советы по покупке и продаже активов. Подробнее — в Условиях использования TradingView.