Forbes just ran with a headline about a Bitcoin “death spiral.” The wording might be sensational, but the risk they are pointing to is real. It is sitting inside Bitcoin treasuries.
Companies like MicroStrategy (NASDAQ:MSTR) and Nakamoto are being packaged as safe institutional gateways to Bitcoin. The truth is, they are not just buying and holding. They are borrowing, issuing debt, and selling shares to continue buying more BTC. That structure works brilliantly when the price is running higher. When BTC pulls back, the debt remains while the value of the collateral falls. If their share prices sink at the same time, they cannot raise fresh equity. That is when forced selling begins, and the pressure feeds on itself.
This is where the LUNA comparison fits. LUNA collapsed because the system relied on TWAP buying to keep its peg alive. It needed a constant programmed demand. The second confidence cracked that demand disappeared, the mechanism broke, and the whole structure fell into a reflexive death spiral. Bitcoin treasuries carry a similar fragility.
They look strong on the way up because debt and dilution keep the system fed. But if one cracks, others will likely follow, and the forced selling could cascade through the market. It is history repeating in a new form.
The Cycle Overlap
Now layer in the cycles. December 2024 marked the rollover of the 8-year stress cycle in traditional markets. That signal has already triggered. But treasuries are not following that rhythm. They are moving in line with Bitcoin’s 4-year cycle. Every halving is followed by a strong run, a cycle top, and then a correction. That puts the real pressure point into December 2025. If treasuries hit the wall at the same time Bitcoin’s bull cycle peaks, the overlap could accelerate a blow-off followed by a brutal correction.
The 8-Year Stress Cycle (Traditional Markets)
2000 → Dot-com bubble rollover. Fed started cutting rates, but equities crashed hard into 2001–2002.
2008 → Global Financial Crisis. Fed slashed rates aggressively, but markets fell into a full-blown meltdown before recovery. 2009 was the brutal washout before recovery.
2016 → Global growth scare, China devaluation, Fed hiking cycle wobble. Markets pulled back, stress showed, then liquidity stepped in.
2024 → December rollover. The signal of cracks returning: inflation sticky, rate cuts being prepped, credit stress building, and leveraged players under pressure.
The pattern - every 8 years, traditional markets hit a rollover point where stress shows up, liquidity shifts, and the system resets.
The 4-Year Bitcoin Cycle
2013 → Top after 2012 halving, deep correction.
2017 → Top after 2016 halving, brutal correction in 2018.
2021 → Top after 2020 halving, correction in 2022.
2025 → Halving cycle points to a top window in December 2025, with correction risk into 2026.
Where Tether Fits
Tether (CRYPTOCAP:USDT) is not just minting stablecoins. It has become one of the largest buyers of short-dated US Treasuries on the planet, with more than 120 billion US dollars worth on its books.
In calm conditions, that makes sense, they clip yield and backstop redemptions. But if markets crash and liquidity dries up, redemptions spike. To meet them, Tether must raise dollars by selling or repo’ing those T-bills. Normally, that is seamless. In stress, selling can add to liquidity drains at the edges of both the Treasury market and crypto. If redemptions surge at the same time treasuries are being forced to sell BTC, you get a double liquidity squeeze.
The Technical Picture
Look at the Fibonacci structure on the chart. The key levels line up with what could be a wave 3 of 3 in Elliott Wave terms — the most explosive part of any trend. That explains the sharp upside move this year. It is powerful, but it is also the phase where leverage and euphoria get stretched the furthest. If this lines up with treasuries cracking and Tether redemptions spiking, the volatility on both sides will be extreme.
2016–2017 vs 2024–2025
In 2016, traditional markets were rattled by China’s devaluation, an oil price collapse, and Fed policy missteps. Liquidity reset the system. For Bitcoin, that reset coincided with the halving and set up the most explosive run in its history. By 2017, equities were making new ATHs and Bitcoin went parabolic to nearly $20k before the brutal 2018 correction.
Now in 2025 we are seeing the same setup. Stress triggered in December 2024, but liquidity is flowing back. Markets everywhere are hitting new ATHs. Bitcoin has surged and is acting like it is in its 2017 phase right now, the blow-off leg of the 4-year cycle.
That puts the risk squarely into December 2025 for a cycle top followed by a correction.
The Cycle Top Target
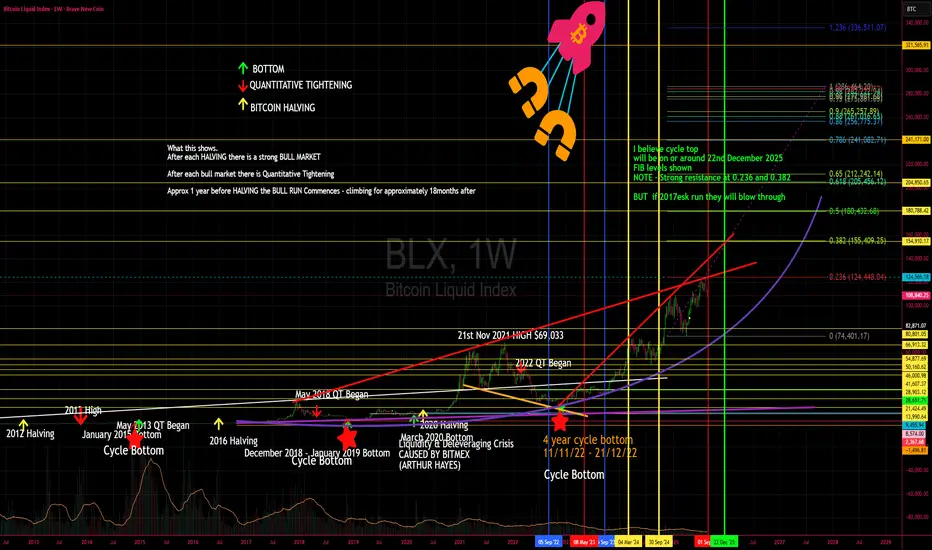
I believe the cycle top for Bitcoin will land on or around 22nd December 2025.
The Fibonacci levels line up cleanly with this window:
Strong resistance at 0.236 and 0.382.
Under normal conditions, these zones would cap the move, but if we are truly in a 2017-style run, price can blow straight through them in a parabolic surge before the eventual correction. Fibs left on the chart for reference.
Key points
BTC treasuries are leveraged and debt-loaded.
Many treasuries exist, not just one, so cascades are possible.
December 2024 = 8-year rollover in traditional markets.
December 2025 = 4-year BTC cycle top window.
Tether can flip from stabiliser to amplifier if redemptions rise.
Fibonacci shows a potential wave 3 of 3, explosive but unsustainable.
2025 mirrors 2017: markets at ATHs, Bitcoin in parabolic mode.
Target: 22nd December 2025 as the likely top.
Stop losses and capital protection are critical.
It looks like BTC 2017 all over again.
The parabolic phase may not be finished yet, but the closer we get to December 2025, the sharper the risk of a brutal correction. This is not Bitcoin dying. This is a test of leverage and liquidity. If treasuries and Tether both get squeezed into the cycle top, the correction could be brutal. But as always, it will clear the field for the next 4-year cycle if you survive the next brutal 2026 BEAR Market.
Thanks for Reading, and please let me know your thoughts
<3 Lisa
Companies like MicroStrategy (NASDAQ:MSTR) and Nakamoto are being packaged as safe institutional gateways to Bitcoin. The truth is, they are not just buying and holding. They are borrowing, issuing debt, and selling shares to continue buying more BTC. That structure works brilliantly when the price is running higher. When BTC pulls back, the debt remains while the value of the collateral falls. If their share prices sink at the same time, they cannot raise fresh equity. That is when forced selling begins, and the pressure feeds on itself.
This is where the LUNA comparison fits. LUNA collapsed because the system relied on TWAP buying to keep its peg alive. It needed a constant programmed demand. The second confidence cracked that demand disappeared, the mechanism broke, and the whole structure fell into a reflexive death spiral. Bitcoin treasuries carry a similar fragility.
They look strong on the way up because debt and dilution keep the system fed. But if one cracks, others will likely follow, and the forced selling could cascade through the market. It is history repeating in a new form.
The Cycle Overlap
Now layer in the cycles. December 2024 marked the rollover of the 8-year stress cycle in traditional markets. That signal has already triggered. But treasuries are not following that rhythm. They are moving in line with Bitcoin’s 4-year cycle. Every halving is followed by a strong run, a cycle top, and then a correction. That puts the real pressure point into December 2025. If treasuries hit the wall at the same time Bitcoin’s bull cycle peaks, the overlap could accelerate a blow-off followed by a brutal correction.
The 8-Year Stress Cycle (Traditional Markets)
2000 → Dot-com bubble rollover. Fed started cutting rates, but equities crashed hard into 2001–2002.
2008 → Global Financial Crisis. Fed slashed rates aggressively, but markets fell into a full-blown meltdown before recovery. 2009 was the brutal washout before recovery.
2016 → Global growth scare, China devaluation, Fed hiking cycle wobble. Markets pulled back, stress showed, then liquidity stepped in.
2024 → December rollover. The signal of cracks returning: inflation sticky, rate cuts being prepped, credit stress building, and leveraged players under pressure.
The pattern - every 8 years, traditional markets hit a rollover point where stress shows up, liquidity shifts, and the system resets.
The 4-Year Bitcoin Cycle
2013 → Top after 2012 halving, deep correction.
2017 → Top after 2016 halving, brutal correction in 2018.
2021 → Top after 2020 halving, correction in 2022.
2025 → Halving cycle points to a top window in December 2025, with correction risk into 2026.
Where Tether Fits
Tether (CRYPTOCAP:USDT) is not just minting stablecoins. It has become one of the largest buyers of short-dated US Treasuries on the planet, with more than 120 billion US dollars worth on its books.
In calm conditions, that makes sense, they clip yield and backstop redemptions. But if markets crash and liquidity dries up, redemptions spike. To meet them, Tether must raise dollars by selling or repo’ing those T-bills. Normally, that is seamless. In stress, selling can add to liquidity drains at the edges of both the Treasury market and crypto. If redemptions surge at the same time treasuries are being forced to sell BTC, you get a double liquidity squeeze.
The Technical Picture
Look at the Fibonacci structure on the chart. The key levels line up with what could be a wave 3 of 3 in Elliott Wave terms — the most explosive part of any trend. That explains the sharp upside move this year. It is powerful, but it is also the phase where leverage and euphoria get stretched the furthest. If this lines up with treasuries cracking and Tether redemptions spiking, the volatility on both sides will be extreme.
2016–2017 vs 2024–2025
In 2016, traditional markets were rattled by China’s devaluation, an oil price collapse, and Fed policy missteps. Liquidity reset the system. For Bitcoin, that reset coincided with the halving and set up the most explosive run in its history. By 2017, equities were making new ATHs and Bitcoin went parabolic to nearly $20k before the brutal 2018 correction.
Now in 2025 we are seeing the same setup. Stress triggered in December 2024, but liquidity is flowing back. Markets everywhere are hitting new ATHs. Bitcoin has surged and is acting like it is in its 2017 phase right now, the blow-off leg of the 4-year cycle.
That puts the risk squarely into December 2025 for a cycle top followed by a correction.
The Cycle Top Target
I believe the cycle top for Bitcoin will land on or around 22nd December 2025.
The Fibonacci levels line up cleanly with this window:
Strong resistance at 0.236 and 0.382.
Under normal conditions, these zones would cap the move, but if we are truly in a 2017-style run, price can blow straight through them in a parabolic surge before the eventual correction. Fibs left on the chart for reference.
Key points
BTC treasuries are leveraged and debt-loaded.
Many treasuries exist, not just one, so cascades are possible.
December 2024 = 8-year rollover in traditional markets.
December 2025 = 4-year BTC cycle top window.
Tether can flip from stabiliser to amplifier if redemptions rise.
Fibonacci shows a potential wave 3 of 3, explosive but unsustainable.
2025 mirrors 2017: markets at ATHs, Bitcoin in parabolic mode.
Target: 22nd December 2025 as the likely top.
Stop losses and capital protection are critical.
It looks like BTC 2017 all over again.
The parabolic phase may not be finished yet, but the closer we get to December 2025, the sharper the risk of a brutal correction. This is not Bitcoin dying. This is a test of leverage and liquidity. If treasuries and Tether both get squeezed into the cycle top, the correction could be brutal. But as always, it will clear the field for the next 4-year cycle if you survive the next brutal 2026 BEAR Market.
Thanks for Reading, and please let me know your thoughts
<3 Lisa
❣️Lisa N Edwards❣️
TRADE MY SIGNALS
gettingstartedincrypto.com/
LISABOT.TRADE
TTMBOT.TRADE
thousandtomillions.com/
ALL MY LINKS linktr.ee/LisaNEdwards
TRADE MY SIGNALS
gettingstartedincrypto.com/
LISABOT.TRADE
TTMBOT.TRADE
thousandtomillions.com/
ALL MY LINKS linktr.ee/LisaNEdwards
Похожие публикации
Отказ от ответственности
Все виды контента, которые вы можете увидеть на TradingView, не являются финансовыми, инвестиционными, торговыми или любыми другими рекомендациями. Мы не предоставляем советы по покупке и продаже активов. Подробнее — в Условиях использования TradingView.