https://www.tradingview.com/x/s2r4NSXF/
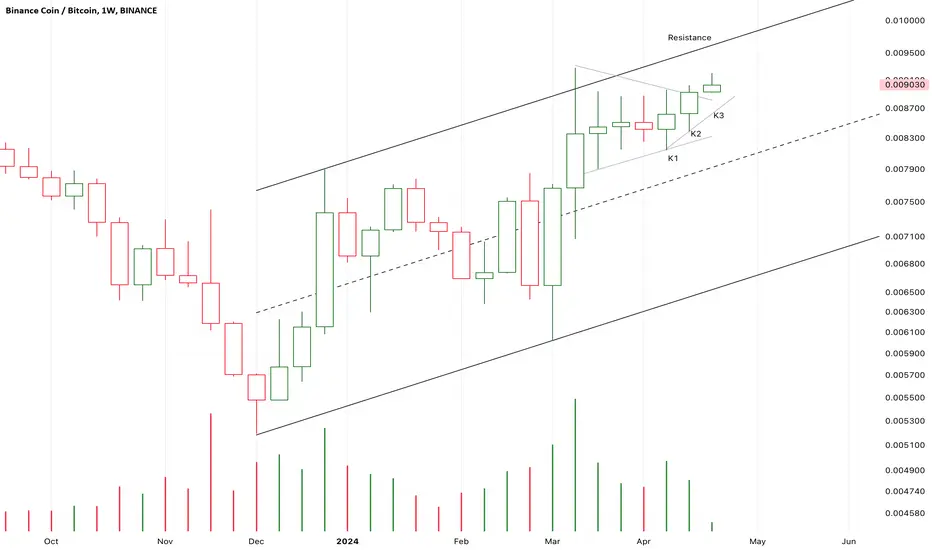
It seems that BNB/BTC is trying to break up a bullish flag.
The possibility is relatively low here.
If K3 finally close upon the resistance,
Another bull run will start here.
If not, K3 will touch the resistance and fall back,
And the horizontal trend will go on.
It seems that BNB/BTC is trying to break up a bullish flag.
The possibility is relatively low here.
If K3 finally close upon the resistance,
Another bull run will start here.
If not, K3 will touch the resistance and fall back,
And the horizontal trend will go on.
Заметка
After a three soldiers advancing pattern(from K1 to K3),
Candles still failed to breaking up a nearest resistance.
It seems that the following candles will consolidate along the support for days.
If the following candles fall back to test the support under low volume,
It will be a good place to buy in.
If K4 close below K3,
I will try to stop loss.
Заметка
K2 just close upon the previous high price.
If the following candles couldn’t return back the potential support.
It will be a potential good place to buy in.
If K3 close below the support or the uptrend line,
The risk will increase.
Заметка
K2 verified the supply pressure sharply increased here,
If K3 couldn’t keep climbing to verify the bullish up engulfing pattern,
The risk will increase.
Заметка
It seems that the consolidation of BNB/USDT had ended,
it is trying to break up a triangle pattern to test 700usdt.
If it finally close upon the upper limit of the triangle,
The BNB will accelerate.
Отказ от ответственности
Информация и публикации не предназначены для предоставления и не являются финансовыми, инвестиционными, торговыми или другими видами советов или рекомендаций, предоставленных или одобренных TradingView. Подробнее читайте в Условиях использования.
Отказ от ответственности
Информация и публикации не предназначены для предоставления и не являются финансовыми, инвестиционными, торговыми или другими видами советов или рекомендаций, предоставленных или одобренных TradingView. Подробнее читайте в Условиях использования.