BPCL (D): Forms Bullish MorningStar, Challenges Major Resistance
After reversing from a short-term downtrend, BPCL (Bharat Petroleum Corporation Ltd) has flashed a powerful bullish signal. However, this newfound momentum is now running directly into a major, long-term resistance trendline that has capped its progress, setting the stage for a critical battle.
The Bullish Setup: A Morning Star at Support
Today's price action (Monday, October 27, 2025) was highly constructive for the bulls:
- Price & Volume Surge: The stock rallied +3.80% on a strong volume of 11.77 million shares.
- Classic Reversal Pattern: This move completed a "Morning Star" candlestick pattern. This is a classic three-candle bullish reversal pattern that often signals the bottom of a downtrend and a new shift in momentum.
Broad-Based Technical Strength
This bullish pattern is strongly supported by a powerful alignment of indicators across all major timeframes (Monthly, Weekly, and Daily):
- Short-Term EMAs: All three timeframes are in a bullish Positive Crossover (PCO) state.
- RSI (Relative Strength Index): The RSI is also in a rising trend on all three timeframes.
This multi-timeframe alignment indicates that the underlying momentum is broad, synchronized, and strengthening.
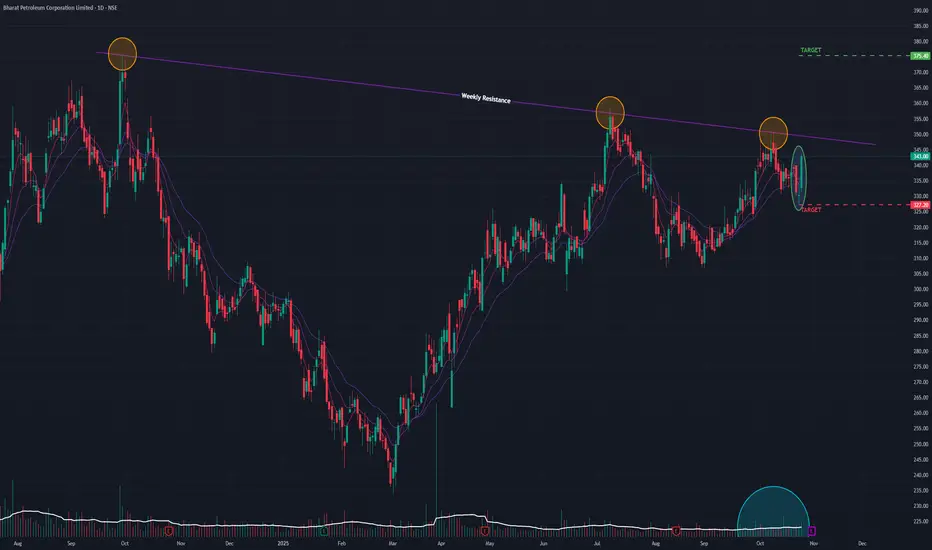
The Immediate Hurdle: Long-Term Resistance
Despite these bullish signals, the stock is now positioned less than 2% below a major long-term resistance trendline formed since its All-Time High. This line represents a significant historical barrier for the stock.
Outlook and Key Levels to Watch
The stock is at a clear "prove it" moment. The outcome of the battle at this resistance will likely determine the next major move.
- Bullish Breakout Scenario: A decisive close above the long-term resistance on high volume would confirm the breakout and validate the Morning Star pattern. This would signal a continuation of the new uptrend, with a potential next target of ₹375.
- Bearish Rejection Scenario: If the stock fails to breach this resistance and momentum fades, it could be rejected. The first key support level would be the bottom of the Morning Star pattern, around ₹325.
In conclusion, the price action in the coming days is critical. All eyes should be on this key resistance level for either a confirmed breakout or a rejection.
The Bullish Setup: A Morning Star at Support
Today's price action (Monday, October 27, 2025) was highly constructive for the bulls:
- Price & Volume Surge: The stock rallied +3.80% on a strong volume of 11.77 million shares.
- Classic Reversal Pattern: This move completed a "Morning Star" candlestick pattern. This is a classic three-candle bullish reversal pattern that often signals the bottom of a downtrend and a new shift in momentum.
Broad-Based Technical Strength
This bullish pattern is strongly supported by a powerful alignment of indicators across all major timeframes (Monthly, Weekly, and Daily):
- Short-Term EMAs: All three timeframes are in a bullish Positive Crossover (PCO) state.
- RSI (Relative Strength Index): The RSI is also in a rising trend on all three timeframes.
This multi-timeframe alignment indicates that the underlying momentum is broad, synchronized, and strengthening.
The Immediate Hurdle: Long-Term Resistance
Despite these bullish signals, the stock is now positioned less than 2% below a major long-term resistance trendline formed since its All-Time High. This line represents a significant historical barrier for the stock.
Outlook and Key Levels to Watch
The stock is at a clear "prove it" moment. The outcome of the battle at this resistance will likely determine the next major move.
- Bullish Breakout Scenario: A decisive close above the long-term resistance on high volume would confirm the breakout and validate the Morning Star pattern. This would signal a continuation of the new uptrend, with a potential next target of ₹375.
- Bearish Rejection Scenario: If the stock fails to breach this resistance and momentum fades, it could be rejected. The first key support level would be the bottom of the Morning Star pattern, around ₹325.
In conclusion, the price action in the coming days is critical. All eyes should be on this key resistance level for either a confirmed breakout or a rejection.
Disclaimer: This analysis is my personal view & for educational purposes only. They shall not be construed as trade or investment advice. Before making any financial decision, it is imperative that you consult with a qualified financial professional.
Отказ от ответственности
Информация и публикации не предназначены для предоставления и не являются финансовыми, инвестиционными, торговыми или другими видами советов или рекомендаций, предоставленных или одобренных TradingView. Подробнее читайте в Условиях использования.