Stock: BSE (Bombay Stock Exchange)
Timeframe: Daily (1D)
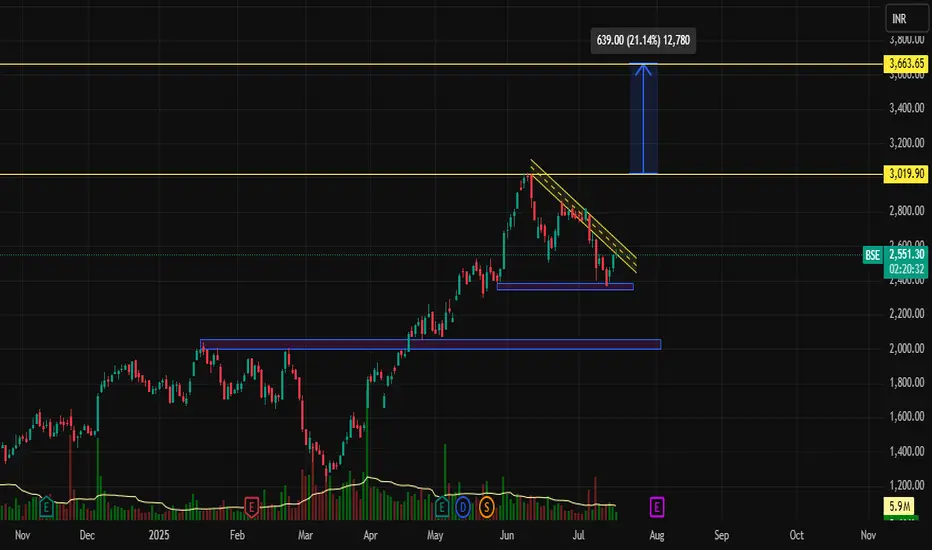
Current Price: ₹2,547.90
Potential Upside: ₹639 (+21.14%)
Resistance Levels: ₹3,019.90, ₹3,663.65
Support Zones: ₹2,370 | ₹2,110
📌 Technical Analysis
1. Falling Wedge Formation (Bullish Reversal Pattern)
BSE is currently trading within a well-defined falling wedge pattern, a classic bullish reversal structure. The stock has been consolidating after a strong uptrend and is approaching the apex of the wedge, indicating a possible breakout.
Downward Sloping Resistance Line is being tested.
The support zone around ₹2,370 has held strong multiple times, creating a solid base.
2. Volume Analysis
Noticeably declining volume during the wedge formation signals a healthy consolidation phase.
A spike in volume on breakout would confirm strong buying momentum.
🔍 Breakout Target Projection
If BSE breaks out from the wedge resistance, the measured move suggests a potential upside of ₹639, bringing the target around:
📍 Target: ₹3,180–3,340 range
📍 Long-Term Resistance: ₹3,663.65 (next major hurdle)
🧠 Strategy Suggestion
Type Entry stop loss entry
Swing Trade ₹2,600–2,650 (after breakout confirmation) ₹2,370 ₹3,019 / ₹3,340 / ₹3,663
Note: Wait for daily candle close above the falling wedge with above-average volume for confirmation.
⚠️ Key Observations
🔹 Bullish momentum from previous uptrend still intact.
🔹 Price respecting demand zone at ₹2,370.
🔹 RSI near neutral – enough room for an upside.
🔹 Ideal breakout zone: Between ₹2,600–2,650
📅 Conclusion
BSE is showing a promising setup with a falling wedge pattern supported by strong demand zones. A successful breakout could lead to a 20%+ rally. Keep this stock on your radar as it nears a potential trend reversal.
📌 Disclaimer: This is not investment advice. Do your own research or consult with a financial advisor before investing.
Timeframe: Daily (1D)
Current Price: ₹2,547.90
Potential Upside: ₹639 (+21.14%)
Resistance Levels: ₹3,019.90, ₹3,663.65
Support Zones: ₹2,370 | ₹2,110
📌 Technical Analysis
1. Falling Wedge Formation (Bullish Reversal Pattern)
BSE is currently trading within a well-defined falling wedge pattern, a classic bullish reversal structure. The stock has been consolidating after a strong uptrend and is approaching the apex of the wedge, indicating a possible breakout.
Downward Sloping Resistance Line is being tested.
The support zone around ₹2,370 has held strong multiple times, creating a solid base.
2. Volume Analysis
Noticeably declining volume during the wedge formation signals a healthy consolidation phase.
A spike in volume on breakout would confirm strong buying momentum.
🔍 Breakout Target Projection
If BSE breaks out from the wedge resistance, the measured move suggests a potential upside of ₹639, bringing the target around:
📍 Target: ₹3,180–3,340 range
📍 Long-Term Resistance: ₹3,663.65 (next major hurdle)
🧠 Strategy Suggestion
Type Entry stop loss entry
Swing Trade ₹2,600–2,650 (after breakout confirmation) ₹2,370 ₹3,019 / ₹3,340 / ₹3,663
Note: Wait for daily candle close above the falling wedge with above-average volume for confirmation.
⚠️ Key Observations
🔹 Bullish momentum from previous uptrend still intact.
🔹 Price respecting demand zone at ₹2,370.
🔹 RSI near neutral – enough room for an upside.
🔹 Ideal breakout zone: Between ₹2,600–2,650
📅 Conclusion
BSE is showing a promising setup with a falling wedge pattern supported by strong demand zones. A successful breakout could lead to a 20%+ rally. Keep this stock on your radar as it nears a potential trend reversal.
📌 Disclaimer: This is not investment advice. Do your own research or consult with a financial advisor before investing.
Сделка активна
prise movement in patternОтказ от ответственности
Все виды контента, которые вы можете увидеть на TradingView, не являются финансовыми, инвестиционными, торговыми или любыми другими рекомендациями. Мы не предоставляем советы по покупке и продаже активов. Подробнее — в Условиях использования TradingView.
Отказ от ответственности
Все виды контента, которые вы можете увидеть на TradingView, не являются финансовыми, инвестиционными, торговыми или любыми другими рекомендациями. Мы не предоставляем советы по покупке и продаже активов. Подробнее — в Условиях использования TradingView.