Downtrend Reversal:
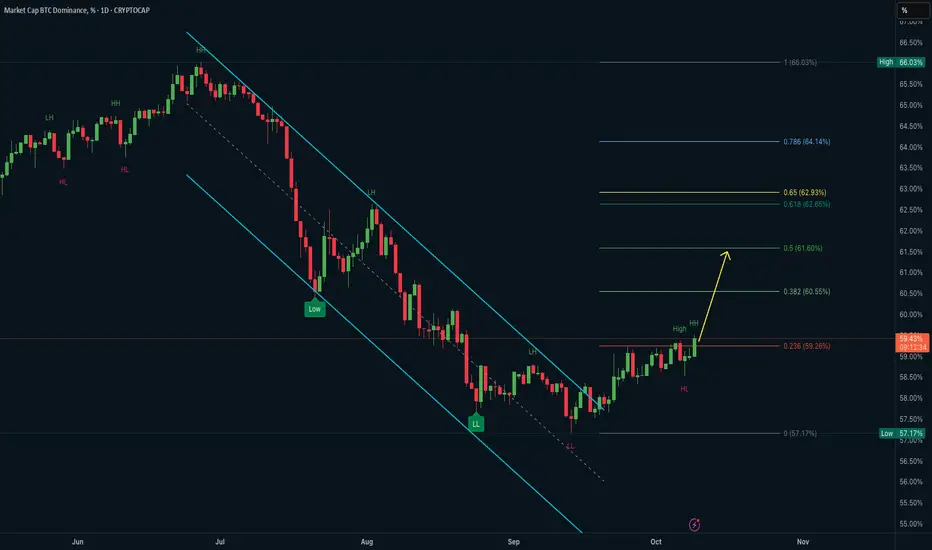
➡️ The macro bearish channel from May–September has been invalidated with a clean breakout.
➡️ Structure shift confirmed: LL → HL → HH
➡️ Volume is increasing on breakout attempts, indicating growing strength in BTC over alts.
Fibonacci Target Zones:
➡️ Nearest target sits at the 0.382 retracement (60.55%)
➡️ Extension levels suggest confluence zones at:
• 61.60% (0.382 ext)
• 62.65%–62.93% (0.618–0.65 Fib cluster)
• 63.32% (0.236 from macro swing)
Support Levels:
➡️ Strong support below at 58.95%–58.58%, marking the previous breakout zone
➡️ HL confirmed above 57.17%, locking in the new bullish structure
📌 What This Means:
A rising BTC.D typically signals capital rotation back into BTC, reducing relative altcoin strength. If dominance reaches the 62%+ range, it may coincide with BTC breaking out while alts underperform.
Отказ от ответственности
Все виды контента, которые вы можете увидеть на TradingView, не являются финансовыми, инвестиционными, торговыми или любыми другими рекомендациями. Мы не предоставляем советы по покупке и продаже активов. Подробнее — в Условиях использования TradingView.
Отказ от ответственности
Все виды контента, которые вы можете увидеть на TradingView, не являются финансовыми, инвестиционными, торговыми или любыми другими рекомендациями. Мы не предоставляем советы по покупке и продаже активов. Подробнее — в Условиях использования TradingView.