Bitcoin update, Bull flag and high OI
Обновлено

I was away yesterday and i thought i posted an update here as well. I did it even before i posted it in my channel, but seems something might went wrong.
............It’s starting to look like we can make another drop. Could be a quick and maybe small shake out to maybe 3920/3890. Alts are still weak, have been all day. Alts need to move up with a sideways bitcoin, not dropping like today...............
Anyway, alts look better again today. The leading alt lately, ETH, still looks bearish, so that worries me a bit. For the rest it looks good.
OI for Bitcoin is very high now, around 415 mil, has not been this high for a while now. So a big move is probably about to happen.
We are still below the 4100, so the danger of a lower high is still very dangerous. We really need to break that level and preferably touch the 4200ish at least once as well. On the left we can see a bull flag, there we can see there is room for a small drop to make a higher low inside the flag before going up. Normally we should not touch the low of yesterday again.
On the right we can see, there is room for a very small drop, but we want to see bulls step in there. This would confirm the high OI is bullish instead of bearish. So it will probably be a few important hours.
I will post a new analysis later today
Previous analysis:
Заметка
What a day again, with some fake moves and Bart moves. This market is just horrible when volumes are low. Anyway, the very bullish version on the right looked like it would play out with the break up today, but that Bart move with high volume dump prevented it. Now there is a chance a bigger bull flag is in play now, the one we can see on the left. So far it's following the blue line, but it is important that we see that smaller green zone hold, to form a higher low. If that plays out, this all is probably just noise and we will see the market move up again during the day and we should see a break up within 24 hours.
If this support breaks, we could be testing the 3820/60 range (Bitstamp).
OI was quite high earlier today, i was actually even surprised to see it when i got back home yesterday. So maybe it was all just a shake out.
I think XRP can be a very good clue now, to what the market will do this week. I think we need to watch the range of the past 48H. A break down will prob mean the market will test lows again, a break up might mean we will start a new rally
Заметка
Things looked good yesterday, but out of nowhere we got a big volume dump after the break of the high. This shows us that; - The break up was to soon, some people still need to get in at current prices
- The bears are at it again and just dump the price and the current movement is just re distribution.
I can't say which one it is at the moment. This sideways price action is difficult to judge. Alts show mixed signals, with ETH being bearish, others being weak but several other are bullish. So nothing clear from that side.
OI on Mex is at 405mil, which is a good healthy level for this price zone. But we had the ingredients yesterday as well to move up, but it got dumped.
The price keeps getting pushed up when we enter the 3980/3950 zone. Just too many mixed signals at the moment. I am just disappointed, that after the 2 weeks Holidays, we would be taking a direction, below 3700/3600 or above 4000/4200. Now it looked like the last one was chosen with that break up. But still here we are.
The bull have on important thing in favor, that is the higher lows. That trend line on the seems to be important already, above that line it's simple, chances up are higher. 3900/3880 is still a normal healthy correction. Below that last green support zone, things will probably change completely. I might even step away from my big picture ABC correction to the 5K's. Of course depends on how things go and the volumes.
I got nothing real to say here now, wish i had but i don't :(
Заметка
New Litecoin analysis:
Заметка
New ETH analysis:
Заметка
Just so boring, more that 3 days of this crap. But it looks like it might be coming to an end soon, cause it looks like a triangle now. Probably get our answer soon for the inverse H&S, if it will fail or succeed Заметка
Posted a new Bitcoin analysis: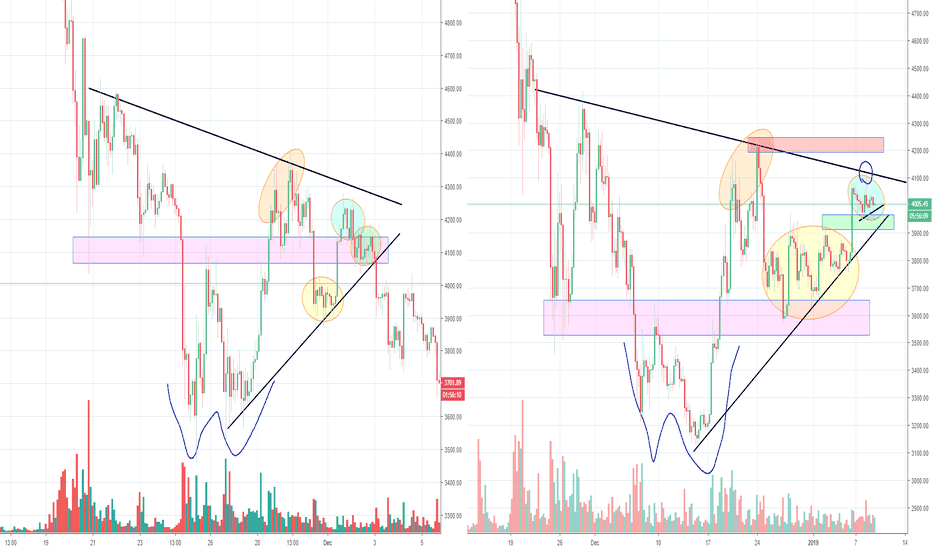
Заметка
New XRP analysis:
Отказ от ответственности
Все виды контента, которые вы можете увидеть на TradingView, не являются финансовыми, инвестиционными, торговыми или любыми другими рекомендациями. Мы не предоставляем советы по покупке и продаже активов. Подробнее — в Условиях использования TradingView.