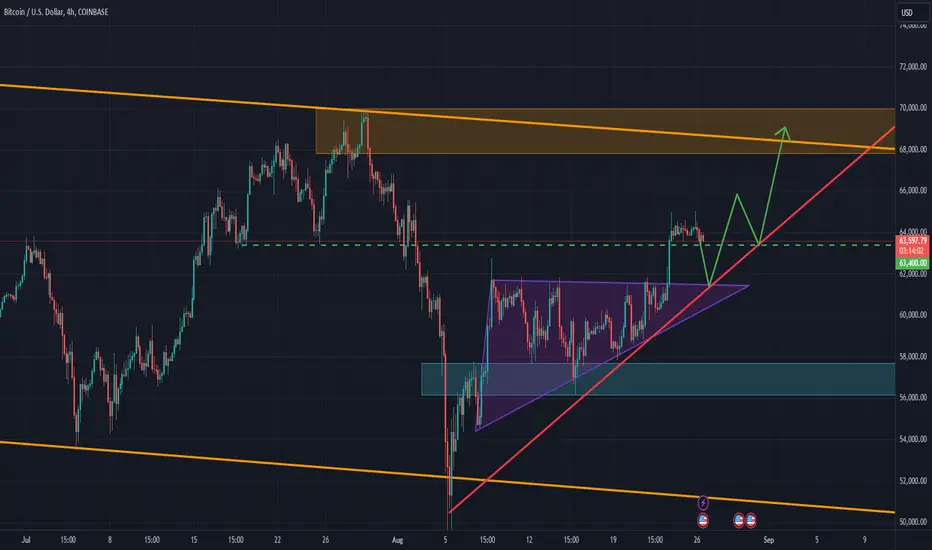
BTCUSDT has broken out and closed above the triangle pattern, which is generally seen as a trend continuation signal. On the daily chart, the overall outlook remains unchanged; the price has merely rebounded from the lower boundary of the consolidation zone. If you look closely, there was accumulation near the 60,000 level, suggesting that the price might pull back to this area, find support, and then rise further. I believe the market is in the process of forming the second extension leg of the triangle pattern. Moreover, on the weekly chart, the price has broken above the inside bar pattern, which is another bullish indicator. The target is the resistance zone around 69,000.
Website - rtedinvesting.com/
Free Telegram Channel - t.me/rtedinvestingofficialfreechannel
Free Telegram Channel - t.me/rtedinvestingofficialfreechannel
Отказ от ответственности
Все виды контента, которые вы можете увидеть на TradingView, не являются финансовыми, инвестиционными, торговыми или любыми другими рекомендациями. Мы не предоставляем советы по покупке и продаже активов. Подробнее — в Условиях использования TradingView.