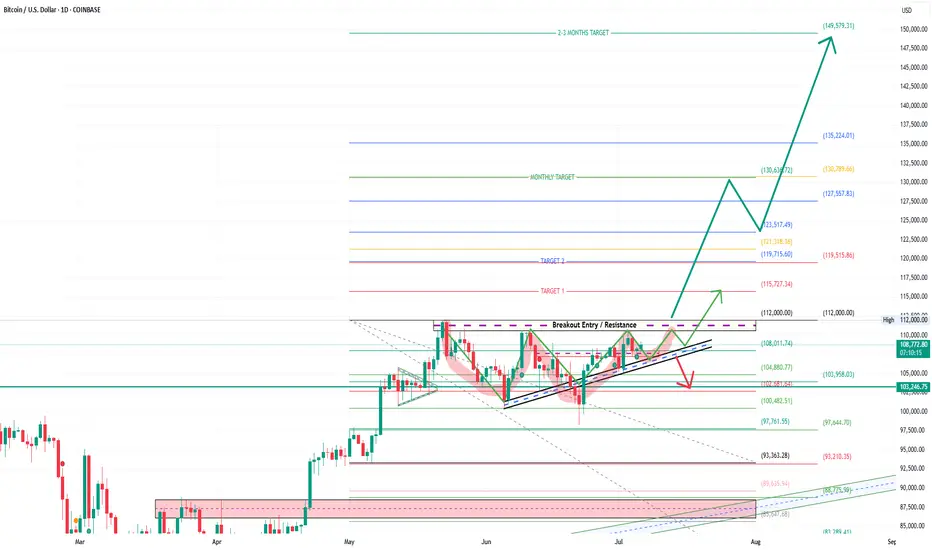
Bitcoin is forming a strong ascending triangle pattern, approaching a key horizontal resistance zone near $112,000, as marked by “Breakout Entry / Resistance” on the chart.
The price structure shows higher lows converging under a flat top, which indicates potential energy build-up for a major breakout. The setup suggests strong bullish momentum if the breakout confirms with volume.
Key Levels & Targets:
Breakout Level: $112,000
Target 1: $115,727
Target 2: $123,517
Monthly Target: $130,639
Extended Targets (2–3 Month Outlook): $135,224 → $149,579
Support Zones to Watch:
$108,011 → $104,880 (ascending trendline)
$103,958 → $100,482 (critical support)
Breakdown invalidation: Below $97,761 could trigger deeper downside
Trade Plan:
Entry Zone: On breakout above $112,000
Stop Loss: Below $104,880 (aggressive), or $103,246 (safe)
Target Path: $115K → $123K → $130K → $149K
Pattern: Ascending Triangle Breakout
Risk-Reward: High reward with well-defined risk control
Bitcoin’s trend is aligning with strong demand and pattern continuation signals, supported by breakout volume zones and long-term Fibonacci levels. This may be the start of a major leg higher if resistance is flipped to support.
Disclaimer:
This chart is for educational purposes only. Please consult your financial advisor and apply proper risk management before entering or exiting trades.
Заметка
SUBSCRIBE to @TheBreakoutAnalyst on YOUTUBE– your ultimate destination for sharp, real-time stock market insights! 📈 On this channel, we break down powerful breakout setups, provide BTST/STBT ideas, and deliver intraday trading strategies with clear technical analysis. Whether you're a beginner or a seasoned trader, @TheBreakoutAnalyst helps you stay ahead with actionable charts, timely updates, and no-fluff market breakdowns. Subscribe now and trade smarter every day! 💹Отказ от ответственности
Все виды контента, которые вы можете увидеть на TradingView, не являются финансовыми, инвестиционными, торговыми или любыми другими рекомендациями. Мы не предоставляем советы по покупке и продаже активов. Подробнее — в Условиях использования TradingView.
Отказ от ответственности
Все виды контента, которые вы можете увидеть на TradingView, не являются финансовыми, инвестиционными, торговыми или любыми другими рекомендациями. Мы не предоставляем советы по покупке и продаже активов. Подробнее — в Условиях использования TradingView.