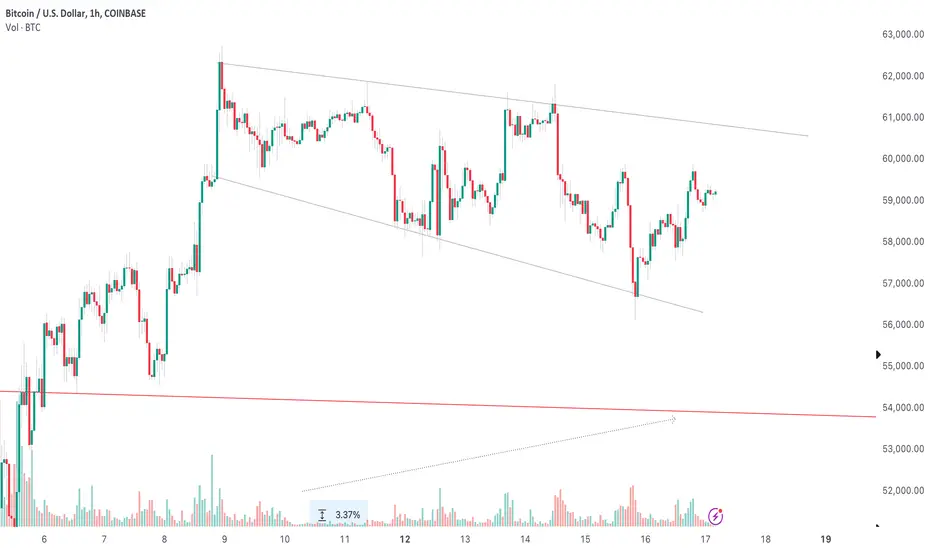
Bitcoin is in a highly volatile and indecisive phase. Everyone is waiting for a clear sign that BTC will go higher or test lower lows.
During these times, it can be beneficial to examine lower timeframes (e.g., 1H) to gain a better sense of the market.
Unfortunately, the lower timeframe sends some warning signals.
Let me explain.
Bitcoin trades in a descending broadening wedge - a chart pattern characterized by two diverging trendlines and the price making lower highs and lower lows.
Typically, this is a good sign since the pattern will likely break out to the top and ignite bullish momentum.
But there is a twist.
Volume plays an essential role when assessing this pattern. As the pattern evolves, you want a decreasing volume.
This indicates that selling pressure is getting lower despite a lower price, which can ultimately lead to a bullish breakout.
Looking at Bitcoin, the opposite is true. Volume has increased while the pattern has evolved. Even worse, we can see the biggest volume is on the selling side.
In this case, there's a huge chance that instead of an upward breakout, the price could break downwards, continuing the preceding downtrend.
What to do:
- Closely monitor the upper and lower trendlines + volume
- A strong volume increase usually drives a breakout
- Breakout attempts with little volume are usually not successful
Отказ от ответственности
Информация и публикации не предназначены для предоставления и не являются финансовыми, инвестиционными, торговыми или другими видами советов или рекомендаций, предоставленных или одобренных TradingView. Подробнее читайте в Условиях использования.
Отказ от ответственности
Информация и публикации не предназначены для предоставления и не являются финансовыми, инвестиционными, торговыми или другими видами советов или рекомендаций, предоставленных или одобренных TradingView. Подробнее читайте в Условиях использования.