🧭 General Overview
Timeframe: 4H
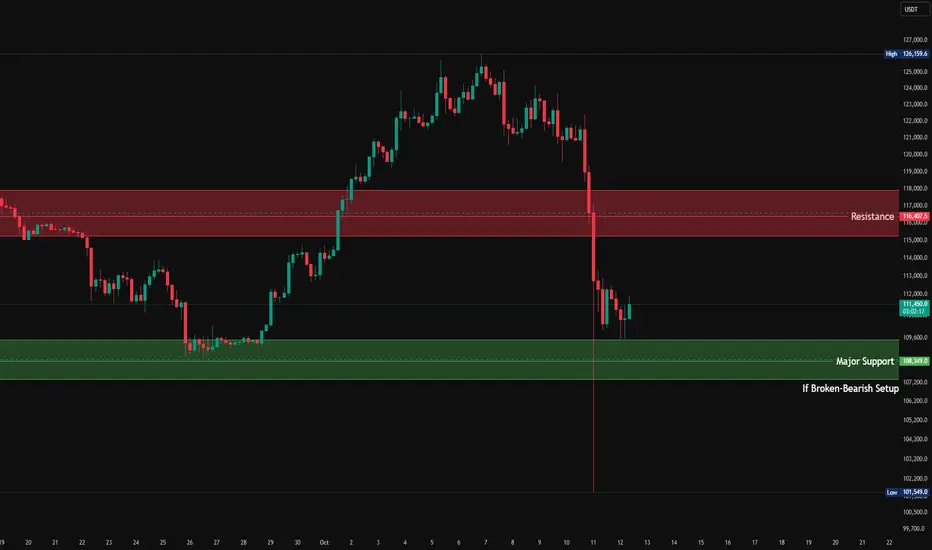
Asset: USDT-BTC
Current Price: ≈ 111,300 USDT
Major Resistance Zone: 116,000–116,400 USDT
Major Support Zone: 108,000–108,350 USDT
Recent High: 126,159 USDT
Recent Low: 101,549 USDT
Price recently rejected from the resistance zone after a strong breakdown, suggesting momentum has turned bearish in the short term.
🧩 Structure & Key Zones
1️⃣ Resistance Zone: 116,000–116,400 USDT
This zone acted as previous support that broke down sharply.
On retest, it now serves as major supply/resistance.
A strong bearish candle initiated from this zone, showing seller dominance.
📉 Expect:
Sellers to re-enter aggressively if price tests this level again.
A lower high formation below 116K = confirmation of short-term bearish bias.
2️⃣ Support Zone: 108,000–108,350 USDT
This is a major demand area, visible from the past bounce.
Price has wicked into it but hasn’t closed below yet — buyers are still defending.
⚠️ If this zone breaks (close below 108K):
Opens room for a deeper correction toward:
106,200 → 103,000 → 101,500 (recent swing low)
📅 Next Week’s Outlook
🔹 Bullish Scenario (Short-Term Relief Rally)
If price holds above 108K and breaks above 112K, we could see:
Short-term bounce toward 114.5K–116K (Resistance Retest)
Watch for rejection candles or weakening momentum there.
Suitable for short-term scalp longs, but risky for swing trades due to strong overhead supply.
🔹 Bearish Scenario (Primary Bias)
Given:
Strong downtrend continuation
Failed recovery attempts
Rejection from prior demand turned supply zone (116K)
If 108K fails, expect:
Acceleration to 105K–102K
Possible overshoot wicks below 101.5K before consolidation or reversal attempt.
Bearish targets for next week (if breakdown occurs):
TP1 → 106,200
TP2 → 103,000
TP3 → 101,500
🕐 Short-Term Perspective (Next 24–72 Hours)
Price is currently consolidating sideways between 111K–108K.
Watch for a range break:
Above 112K → short-term bullish relief
Below 108K → confirmation of bearish continuation
Volume and candle body analysis suggest that sellers are stronger, but buyers are still defending 108K strongly.
🔍 Key Takeaways
The trend is bearish, but we’re at critical support.
Watch 108K closely — it’s the line between correction & collapse.
Any bounce toward 114–116K is likely a sell opportunity.
A breakdown below 108K opens path toward the 100–102K zone.
Отказ от ответственности
Все виды контента, которые вы можете увидеть на TradingView, не являются финансовыми, инвестиционными, торговыми или любыми другими рекомендациями. Мы не предоставляем советы по покупке и продаже активов. Подробнее — в Условиях использования TradingView.
Отказ от ответственности
Все виды контента, которые вы можете увидеть на TradingView, не являются финансовыми, инвестиционными, торговыми или любыми другими рекомендациями. Мы не предоставляем советы по покупке и продаже активов. Подробнее — в Условиях использования TradingView.