Most traders focus on breakouts.
Very few ask a more important question:
Is this move strong enough to create market consensus?
In large-cap markets like BTC, Gold, or major forex pairs, no single institution can move price sustainably on its own. Every directional move must begin with a test — what I call ignition — followed by confirmation from the crowd — what I call follow-through.

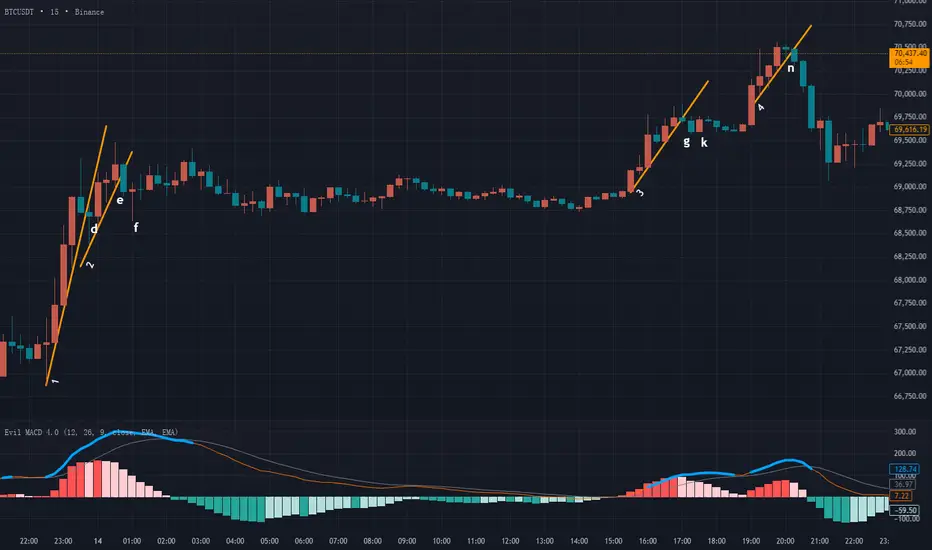
First, we can see a large section of blue warning signals, indicating a potential top. Then Trendline 1 is formed. This trendline has been validated by the market. It is broken downward at point d.
However, we need to pay attention to the breakout candle itself. It is almost a doji — very small body with a long lower wick. After point d, price immediately rebounds. Therefore, this cannot be considered a valid bullish-to-bearish structural shift.
Later, the upward movement forms Trendline 2, which is also validated by the market. At point e, we see a downward breakout. This time, the candle body dominates and the wicks are negligible. Here, we can identify a structural transition from bullish to bearish.
But the key question today is:
If we enter a short position here, where is the take-profit space?
This leads to today’s core concept:
Market consensus — ignition and follow-through.
There are many traders in the market: retail traders of different sizes, institutions, and companies with massive capital. Large institutions are not necessarily unified under one single opinion. Different participants may hold different views.
That is why, most of the time, price action appears disorderly and range-bound, without a clear direction.
However, sometimes we see sudden acceleration — sharp rallies or sharp drops.
In small-cap assets, such moves may indeed be driven by a single large operator. But what about large-cap instruments like Bitcoin (BTC), Gold (XAU), or major forex pairs?
In markets of this size, the impact of any single institution is negligible. Therefore, directional moves in large-cap markets are better understood as a form of market consensus — a direction recognized and supported by the majority of participants.
Only when aggressive market orders continuously absorb passive limit orders from the opposite side can price move rapidly in one direction.
Reversals do not happen instantly with a clean turn.
Instead, a portion of the opposing force begins to act first. This is a test.
I call this action “ignition.”
After ignition, we observe whether the fire spreads.
If it does not spread, conditions are not ready.
Many fake breakouts, long wicks, and deceptive moves we see on the chart are actually ignition attempts.
Why is ignition necessary?
Because in large-cap markets, pushing price requires enormous cost. It demands a large amount of aggressive orders to absorb liquidity — including newly placed passive orders during the process. Few institutions can afford to force a move alone.
At point e, we can interpret the breakdown as an ignition attempt by sellers — testing whether the market has reached a critical level where most participants are willing to align short.
If ignition triggers a chain reaction, if others follow and join the short side, then that ignition point becomes the lowest-cost entry for bears.
But then comes point f.
The long lower wick at f tells us something important. Sellers once pushed price lower, but their momentum faded. Buyers stepped in and pushed price back up toward the close, even forming a small bullish doji.
This tells us that ignition failed.
There was no follow-through.
The market is always uncertain. Reversals can occur at any time. Viewing the market through the lens of ignition and follow-through helps us understand many behaviors that otherwise seem random.
If we entered short at e, once we see f, we should immediately recognize that the ignition attempt has failed and exit quickly. The loss here is small, close to breakeven. This is flexible and scientific risk management.
This analytical framework is inspired by The Wyckoff Method, though the concepts of “ignition” and “follow-through” are my own interpretation and extension.
The same situation appears after Trendline 3. However, Trendline 3 itself was not properly validated, so the reversal probability is lower from the start.
At point g, we see a strong bearish candle breaking down — another ignition attempt by sellers.
But then at k, a bullish candle completely engulfs the previous move. Its body exceeds that of g, which tells us that not only did follow-through fail, but buyers aggressively suppressed the move.
This shows that bearish consensus is weak.
After k, even before reaching the stop-loss level, the following small bearish candles show no strong downside momentum. This confirms the hypothesis: sellers lack strength.
The correct decision here is to exit near breakeven with a small loss.
Finally, we see Trendline 4.
At point n, price breaks downward again. The logic is satisfied:
Blue warning signal
Formation of trendline
Reverse breakout
This is another ignition attempt by sellers.
But this time, we clearly observe follow-through. Larger bearish candles appear afterward. More traders and institutions accept the ignition and align with the short side.
This is where true market consensus forms.
As I said before:
We should enter at points with the highest probability of aligning with market consensus.
How far consensus carries us requires a bit of luck.
We can objectively identify ignition points from the chart.
But we cannot predict whether follow-through will occur.
However, entering at these locations gives us:
Probability advantage
Favorable risk-reward ratio
Once consensus forms, price often moves quickly and decisively.
In today’s BTC example, there were three ignition attempts.
Two failed. One succeeded.
But that one successful trade covers the losses of the previous two.
When you truly understand ignition, follow-through, and market consensus, your understanding of price action becomes deeper — closer to the essence of the market.
Very few ask a more important question:
Is this move strong enough to create market consensus?
In large-cap markets like BTC, Gold, or major forex pairs, no single institution can move price sustainably on its own. Every directional move must begin with a test — what I call ignition — followed by confirmation from the crowd — what I call follow-through.
First, we can see a large section of blue warning signals, indicating a potential top. Then Trendline 1 is formed. This trendline has been validated by the market. It is broken downward at point d.
However, we need to pay attention to the breakout candle itself. It is almost a doji — very small body with a long lower wick. After point d, price immediately rebounds. Therefore, this cannot be considered a valid bullish-to-bearish structural shift.
Later, the upward movement forms Trendline 2, which is also validated by the market. At point e, we see a downward breakout. This time, the candle body dominates and the wicks are negligible. Here, we can identify a structural transition from bullish to bearish.
But the key question today is:
If we enter a short position here, where is the take-profit space?
This leads to today’s core concept:
Market consensus — ignition and follow-through.
There are many traders in the market: retail traders of different sizes, institutions, and companies with massive capital. Large institutions are not necessarily unified under one single opinion. Different participants may hold different views.
That is why, most of the time, price action appears disorderly and range-bound, without a clear direction.
However, sometimes we see sudden acceleration — sharp rallies or sharp drops.
In small-cap assets, such moves may indeed be driven by a single large operator. But what about large-cap instruments like Bitcoin (BTC), Gold (XAU), or major forex pairs?
In markets of this size, the impact of any single institution is negligible. Therefore, directional moves in large-cap markets are better understood as a form of market consensus — a direction recognized and supported by the majority of participants.
Only when aggressive market orders continuously absorb passive limit orders from the opposite side can price move rapidly in one direction.
Reversals do not happen instantly with a clean turn.
Instead, a portion of the opposing force begins to act first. This is a test.
I call this action “ignition.”
After ignition, we observe whether the fire spreads.
If it does not spread, conditions are not ready.
Many fake breakouts, long wicks, and deceptive moves we see on the chart are actually ignition attempts.
Why is ignition necessary?
Because in large-cap markets, pushing price requires enormous cost. It demands a large amount of aggressive orders to absorb liquidity — including newly placed passive orders during the process. Few institutions can afford to force a move alone.
At point e, we can interpret the breakdown as an ignition attempt by sellers — testing whether the market has reached a critical level where most participants are willing to align short.
If ignition triggers a chain reaction, if others follow and join the short side, then that ignition point becomes the lowest-cost entry for bears.
But then comes point f.
The long lower wick at f tells us something important. Sellers once pushed price lower, but their momentum faded. Buyers stepped in and pushed price back up toward the close, even forming a small bullish doji.
This tells us that ignition failed.
There was no follow-through.
The market is always uncertain. Reversals can occur at any time. Viewing the market through the lens of ignition and follow-through helps us understand many behaviors that otherwise seem random.
If we entered short at e, once we see f, we should immediately recognize that the ignition attempt has failed and exit quickly. The loss here is small, close to breakeven. This is flexible and scientific risk management.
This analytical framework is inspired by The Wyckoff Method, though the concepts of “ignition” and “follow-through” are my own interpretation and extension.
The same situation appears after Trendline 3. However, Trendline 3 itself was not properly validated, so the reversal probability is lower from the start.
At point g, we see a strong bearish candle breaking down — another ignition attempt by sellers.
But then at k, a bullish candle completely engulfs the previous move. Its body exceeds that of g, which tells us that not only did follow-through fail, but buyers aggressively suppressed the move.
This shows that bearish consensus is weak.
After k, even before reaching the stop-loss level, the following small bearish candles show no strong downside momentum. This confirms the hypothesis: sellers lack strength.
The correct decision here is to exit near breakeven with a small loss.
Finally, we see Trendline 4.
At point n, price breaks downward again. The logic is satisfied:
Blue warning signal
Formation of trendline
Reverse breakout
This is another ignition attempt by sellers.
But this time, we clearly observe follow-through. Larger bearish candles appear afterward. More traders and institutions accept the ignition and align with the short side.
This is where true market consensus forms.
As I said before:
We should enter at points with the highest probability of aligning with market consensus.
How far consensus carries us requires a bit of luck.
We can objectively identify ignition points from the chart.
But we cannot predict whether follow-through will occur.
However, entering at these locations gives us:
Probability advantage
Favorable risk-reward ratio
Once consensus forms, price often moves quickly and decisively.
In today’s BTC example, there were three ignition attempts.
Two failed. One succeeded.
But that one successful trade covers the losses of the previous two.
When you truly understand ignition, follow-through, and market consensus, your understanding of price action becomes deeper — closer to the essence of the market.
Discord:discord.com/users/1044898599974223902
Contact author to access Invite-Only script
公众号:介喜Jessie
以上渠道可联系作者开通指标
Contact author to access Invite-Only script
公众号:介喜Jessie
以上渠道可联系作者开通指标
Отказ от ответственности
Информация и публикации не предназначены для предоставления и не являются финансовыми, инвестиционными, торговыми или другими видами советов или рекомендаций, предоставленных или одобренных TradingView. Подробнее читайте в Условиях использования.