Stoch RSI (Blue Line)
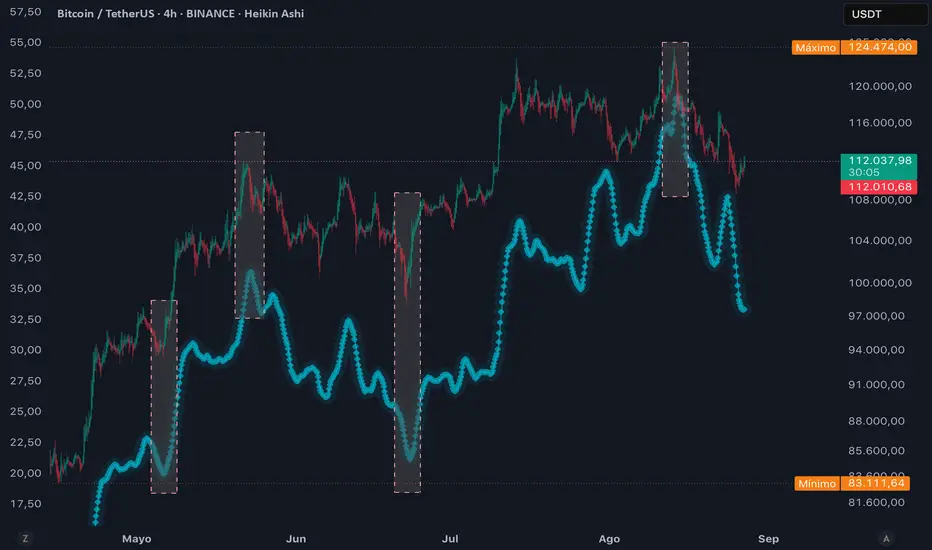
The Stoch RSI is a very useful tool that helps you get a deeper perspective on the market. Think of it as an "indicator of an indicator"; it combines the speed and sensitivity of the Stochastic oscillator with the strength and trend of the Relative Strength Index (RSI).
Combining these tools will give you a more robust and reliable view of the market. Observing the change in the direction of the Stoch RSI indicator (the blue line) shows whether the movement has strength or not, depending on the direction of its turn.
I recommend that you always combine it with other elements of your analysis, such as price action (candlestick patterns), support and resistance levels, and other indicators like trading volume.
///////////////////////////////////////////////////
Stoch RSI (Linea azul)
Es una herramienta muy útil que ayuda a tener una perspectiva más profunda sobre el mercado,
piensa en él como un "indicador de un indicador",combina la velocidad y la sensibilidad del oscilador Estocástico con la fuerza y la tendencia del Índice de Fuerza Relativa (RSI).
La combinación de esta herramientas te dará una visión más robusta y fiable del mercado.
Observar el cambio de direcciòn del indicador Stoch RSI (Linea azul), muestra si el movimiento tiene fuerza o no segun la direccion que realiza el giro.
Te recomiendo que siempre lo combines con otros elementos de tu análisis, como el análisis de la acción del precio (patrones de velas), los niveles de soporte y resistencia, y otros indicadores como el volumen de negociación.
Importante
Tener las velas Heiken Ashi como complemento al analisis
Сделка активна
Importante Tener las velas Heiken Ashi como complemento al analisis
Отказ от ответственности
Информация и публикации не предназначены для предоставления и не являются финансовыми, инвестиционными, торговыми или другими видами советов или рекомендаций, предоставленных или одобренных TradingView. Подробнее читайте в Условиях использования.
Отказ от ответственности
Информация и публикации не предназначены для предоставления и не являются финансовыми, инвестиционными, торговыми или другими видами советов или рекомендаций, предоставленных или одобренных TradingView. Подробнее читайте в Условиях использования.