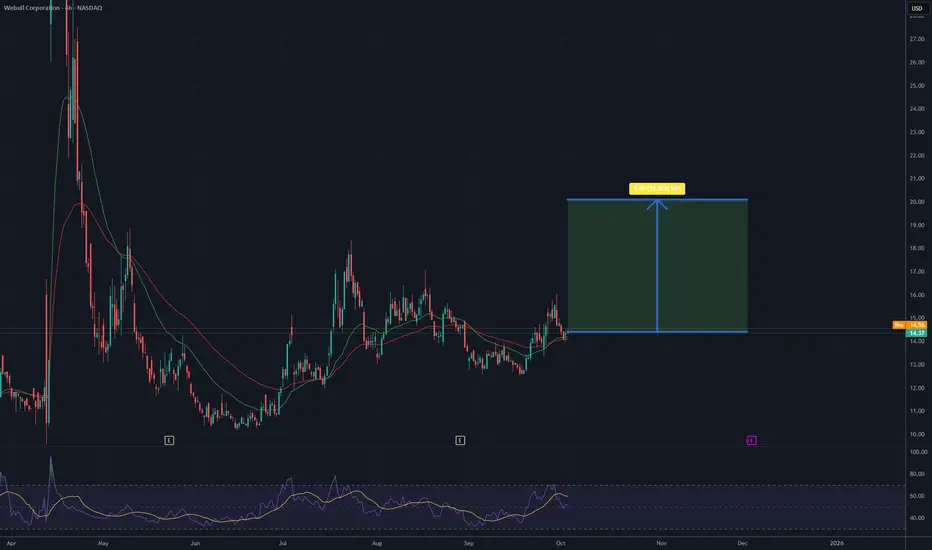
The stock is currently consolidating around the 14.3–14.5 USD area after a previous corrective move down. The 14 USD zone is acting as strong support, where buyers have stepped in to stop further declines. The next resistance level is at 15.5 USD, and a breakout above this point could trigger a return to an upward trend. The RSI indicator shows weakening selling pressure and suggests the possibility of a rebound. The price structure resembles an inverted head and shoulders pattern, which, if confirmed with a breakout, would signal greater upside potential. If the stock holds above support and moves past 15.5 USD, it could first target the 17–18 USD range, and in the following weeks potentially reach as high as 20 USD.
Potential TP: 20 USD
This analysis is for informational and educational purposes only and does not constitute financial advice.
Potential TP: 20 USD
This analysis is for informational and educational purposes only and does not constitute financial advice.
Отказ от ответственности
Все виды контента, которые вы можете увидеть на TradingView, не являются финансовыми, инвестиционными, торговыми или любыми другими рекомендациями. Мы не предоставляем советы по покупке и продаже активов. Подробнее — в Условиях использования TradingView.
Отказ от ответственности
Все виды контента, которые вы можете увидеть на TradingView, не являются финансовыми, инвестиционными, торговыми или любыми другими рекомендациями. Мы не предоставляем советы по покупке и продаже активов. Подробнее — в Условиях использования TradingView.