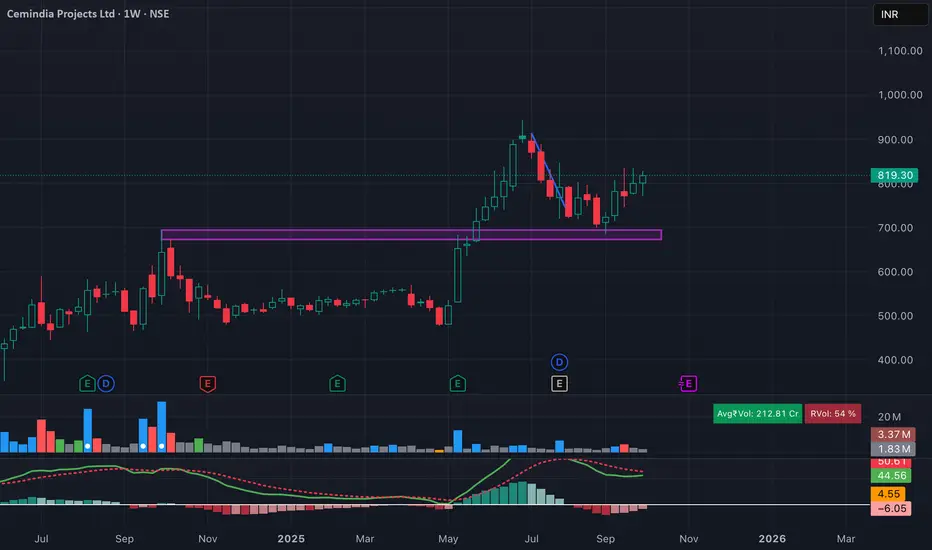
Cemindia Projects has successfully retested its breakout zone around 700–720 and is showing strength on the weekly chart. The stock has formed a higher low and is now turning up with fresh momentum. MACD is flattening out, suggesting trend reversal possibility.
📌 Swing Trade Idea
Entry Zone: Current levels (around 815–820)
Stop Loss (SL): 765 (Weekly closing basis)
View: As long as price holds above 765, bias remains bullish with potential for higher levels in the coming weeks.
📌 Swing Trade Idea
Entry Zone: Current levels (around 815–820)
Stop Loss (SL): 765 (Weekly closing basis)
View: As long as price holds above 765, bias remains bullish with potential for higher levels in the coming weeks.
Отказ от ответственности
Все виды контента, которые вы можете увидеть на TradingView, не являются финансовыми, инвестиционными, торговыми или любыми другими рекомендациями. Мы не предоставляем советы по покупке и продаже активов. Подробнее — в Условиях использования TradingView.
Отказ от ответственности
Все виды контента, которые вы можете увидеть на TradingView, не являются финансовыми, инвестиционными, торговыми или любыми другими рекомендациями. Мы не предоставляем советы по покупке и продаже активов. Подробнее — в Условиях использования TradingView.