Short Analysis:
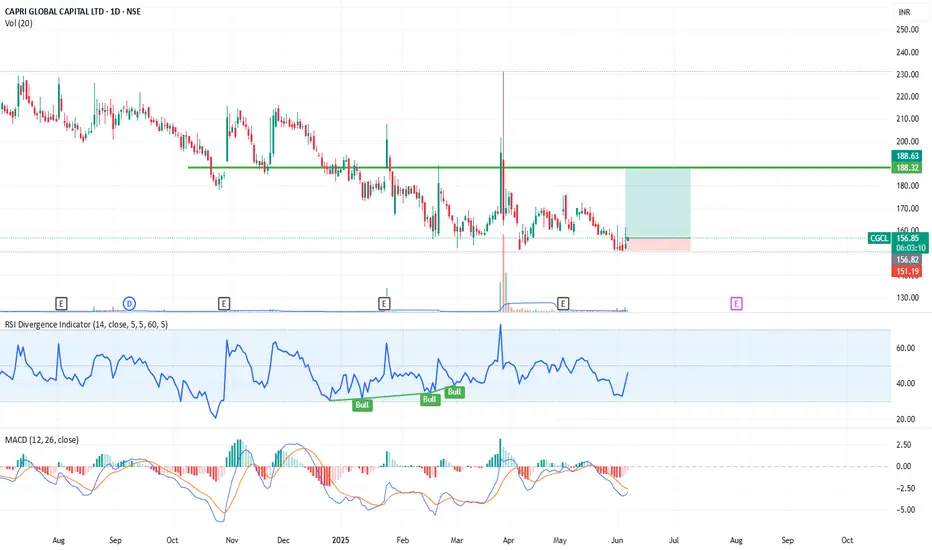
Chart Pattern: The stock is currently trading near a strong horizontal support zone (~₹151–₹155), tested multiple times.
Note: This is not a recommendation, only for study purposes. Do your own analysis and apply proper risk management before making any trading decisions.
Chart Pattern: The stock is currently trading near a strong horizontal support zone (~₹151–₹155), tested multiple times.
- RSI: Shows bullish divergence around 45, indicating potential upward momentum.
- MACD: Close to a bullish crossover, signaling a possible trend reversal.
- Volume: Slight rise in volume supports the current bounce attempt.
- Risk/Reward: Marked risk zone below ₹151.19 and possible target area around ₹188.
Note: This is not a recommendation, only for study purposes. Do your own analysis and apply proper risk management before making any trading decisions.
Отказ от ответственности
Все виды контента, которые вы можете увидеть на TradingView, не являются финансовыми, инвестиционными, торговыми или любыми другими рекомендациями. Мы не предоставляем советы по покупке и продаже активов. Подробнее — в Условиях использования TradingView.
Отказ от ответственности
Все виды контента, которые вы можете увидеть на TradingView, не являются финансовыми, инвестиционными, торговыми или любыми другими рекомендациями. Мы не предоставляем советы по покупке и продаже активов. Подробнее — в Условиях использования TradingView.