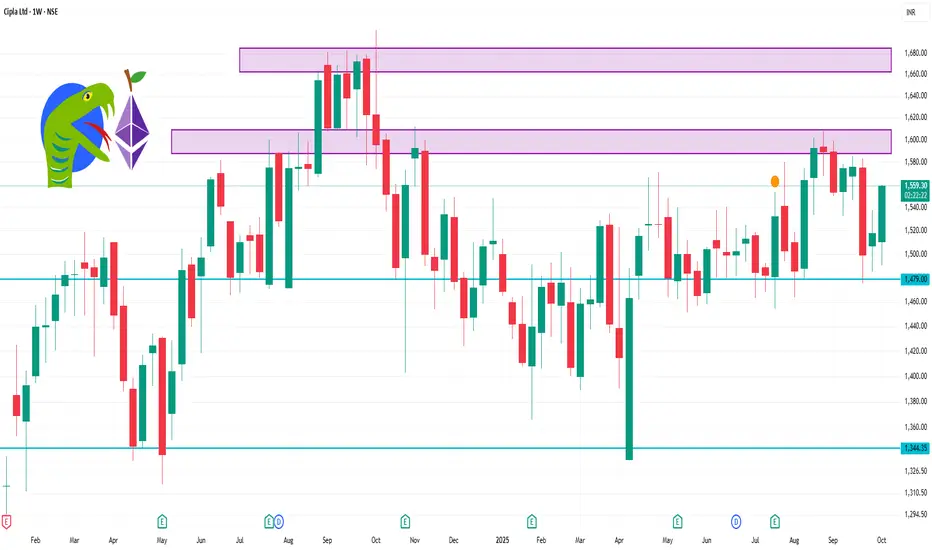
📈 Weekly Support & Resistance Levels
Support Levels:
S1: ₹1,491.53
S2: ₹1,499.17
S3: ₹1,506.48
S4: ₹1,514.12
Resistance Levels:
R1: ₹1,521.43
R2: ₹1,529.07
R3: ₹1,536.38
R4: ₹1,544.70
These levels are derived from the classic pivot point method and can serve as potential entry or exit points for traders.
Technical Indicators Snapshot
Relative Strength Index (RSI): 77.43 (approaching overbought territory)
MACD: 7.01 (bullish crossover)
Average Directional Index (ADX): 30.49 (indicating a strong trend)
Commodity Channel Index (CCI): 307.2 (overbought)
Williams %R: -0.79 (overbought)
Rate of Change (ROC): 3.81% (bullish momentum)
Moving Averages:
5-day: ₹1,527.76
50-day: ₹1,510.91
200-day: ₹1,542.76
Похожие публикации
Отказ от ответственности
Все виды контента, которые вы можете увидеть на TradingView, не являются финансовыми, инвестиционными, торговыми или любыми другими рекомендациями. Мы не предоставляем советы по покупке и продаже активов. Подробнее — в Условиях использования TradingView.
Похожие публикации
Отказ от ответственности
Все виды контента, которые вы можете увидеть на TradingView, не являются финансовыми, инвестиционными, торговыми или любыми другими рекомендациями. Мы не предоставляем советы по покупке и продаже активов. Подробнее — в Условиях использования TradingView.