🔥 CL1! Triple Confluence: POC Return + Dual Divergence + Delta Flat
The Market Participant Battle:
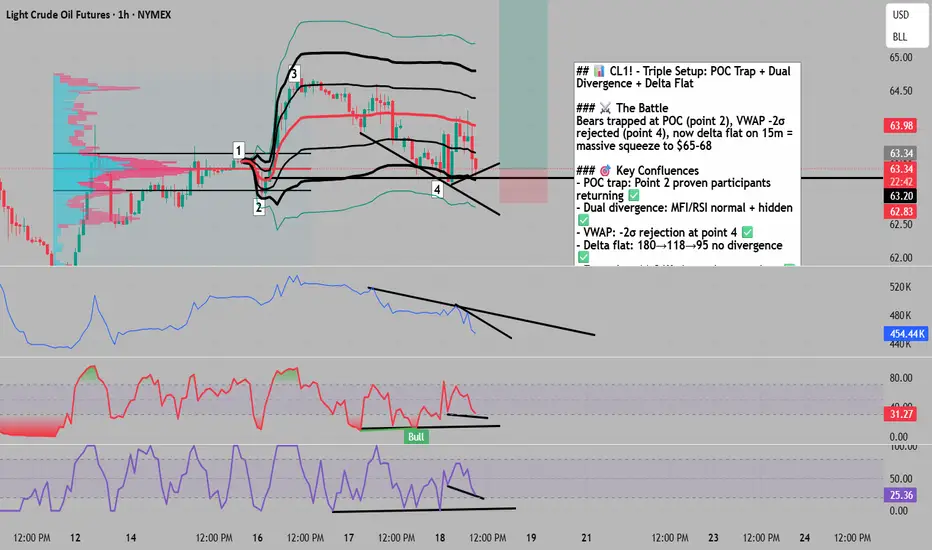
Bears have been systematically crushed at three critical junctures. First, at point 2 (the POC from swing 0→3), establishing proven trapped participants. Second, at point 4 where price pierced VWAP's 2nd deviation only to violently reject. Now, on the 15-minute entry timeframe, we see the final capitulation signal: delta remaining completely flat (no divergence) while price shows bullish divergence. This triple-layered setup reveals bears are not just beaten - they're exhausted, absorbed, and about to fuel a squeeze back to the $65-68 resistance zone as price returns to reclaim the proven participants at point 2.
Confluences:
Confluence 1: POC Market Participant Trap (1H Chart)
The hourly chart reveals the foundation of this trade: Point 2 marks the Point of Control from the major swing 0→3, where maximum volume traded hands. When price closed above point 1, these participants became trapped bears. Now at point 4, we're returning to this proven battleground where shorts will be forced to cover. The numbered reference points (1,2,3,4) map the complete journey of market participants from accumulation to distribution to the current return phase.
Confluence 2: Dual MFI/RSI Divergences (1H Chart)
Both MFI and RSI show an extraordinary dual-divergence setup. First, a normal bullish divergence where price made lower lows while indicators made higher lows. Second, a hidden/continuation divergence confirming the underlying trend remains bullish. This rare combination of two different divergence types on the same indicators typically precedes 3-5% moves. The divergences span from point 2 through point 4, showing sustained buying pressure despite price weakness.
Confluence 3: VWAP 2nd Deviation Rejection + Delta Flat Entry
Using VWAP anchored from point 1, price at point 4 pierced the -2 standard deviation before snapping back - a classic institutional accumulation signal. Now on the 15-minute entry timeframe, we see the trigger: delta completely flat (180→118→95) showing no divergence despite price attempts lower, combined with bullish price divergence. Volume footprint s
The Market Participant Battle:
Bears have been systematically crushed at three critical junctures. First, at point 2 (the POC from swing 0→3), establishing proven trapped participants. Second, at point 4 where price pierced VWAP's 2nd deviation only to violently reject. Now, on the 15-minute entry timeframe, we see the final capitulation signal: delta remaining completely flat (no divergence) while price shows bullish divergence. This triple-layered setup reveals bears are not just beaten - they're exhausted, absorbed, and about to fuel a squeeze back to the $65-68 resistance zone as price returns to reclaim the proven participants at point 2.
Confluences:
Confluence 1: POC Market Participant Trap (1H Chart)
The hourly chart reveals the foundation of this trade: Point 2 marks the Point of Control from the major swing 0→3, where maximum volume traded hands. When price closed above point 1, these participants became trapped bears. Now at point 4, we're returning to this proven battleground where shorts will be forced to cover. The numbered reference points (1,2,3,4) map the complete journey of market participants from accumulation to distribution to the current return phase.
Confluence 2: Dual MFI/RSI Divergences (1H Chart)
Both MFI and RSI show an extraordinary dual-divergence setup. First, a normal bullish divergence where price made lower lows while indicators made higher lows. Second, a hidden/continuation divergence confirming the underlying trend remains bullish. This rare combination of two different divergence types on the same indicators typically precedes 3-5% moves. The divergences span from point 2 through point 4, showing sustained buying pressure despite price weakness.
Confluence 3: VWAP 2nd Deviation Rejection + Delta Flat Entry
Using VWAP anchored from point 1, price at point 4 pierced the -2 standard deviation before snapping back - a classic institutional accumulation signal. Now on the 15-minute entry timeframe, we see the trigger: delta completely flat (180→118→95) showing no divergence despite price attempts lower, combined with bullish price divergence. Volume footprint s
for trading mentorship and community, message me on telegram : jacesabr_real
Отказ от ответственности
The information and publications are not meant to be, and do not constitute, financial, investment, trading, or other types of advice or recommendations supplied or endorsed by TradingView. Read more in the Terms of Use.