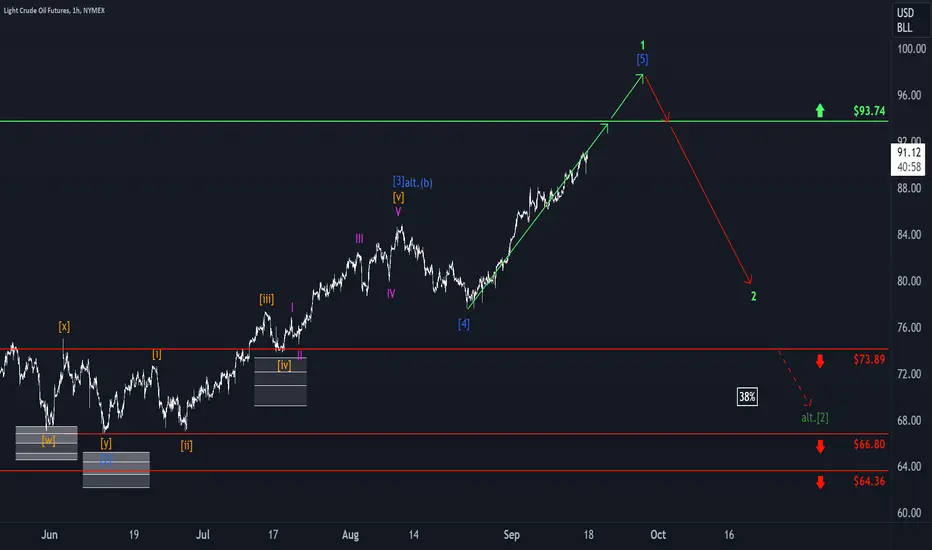
WTI is riding a robust bullish wave, propelling it to its highest levels in 10 months. In our analysis, we anticipate that, to complete the blue wave [5], it must surpass the resistance at $93.74. Subsequently, a noteworthy descent is in the cards. It’s essential to note that a dip below $73.89, though with a 38% probability in our estimation, signifies a further decline within the green wave alt.[2].
📊 Daily market insights combining macro + Elliott Wave analysis
🚀 Spot trends early with momentum, sentiment & price structure
🌐 Join thousands trading smarter at hkcmglobal.com
🚀 Spot trends early with momentum, sentiment & price structure
🌐 Join thousands trading smarter at hkcmglobal.com
Похожие публикации
Отказ от ответственности
Информация и публикации не предназначены для предоставления и не являются финансовыми, инвестиционными, торговыми или другими видами советов или рекомендаций, предоставленных или одобренных TradingView. Подробнее читайте в Условиях использования.