CRCL (Circle Internet Group, Inc.) is a financial technology company specializing in blockchain infrastructure. It is best known as the issuer of USD Coin (USDC), one of the leading stablecoins in the market, backed 1:1 with U.S. dollars.
Circle Internet Group, Inc. (CRCL) began trading this June following its initial public offering at USD 32 per share. On its debut (Thursday the 5th), the stock doubled, opening at USD 64 and closing at USD 83.23, marking a strong start for this new NYSE ticker.
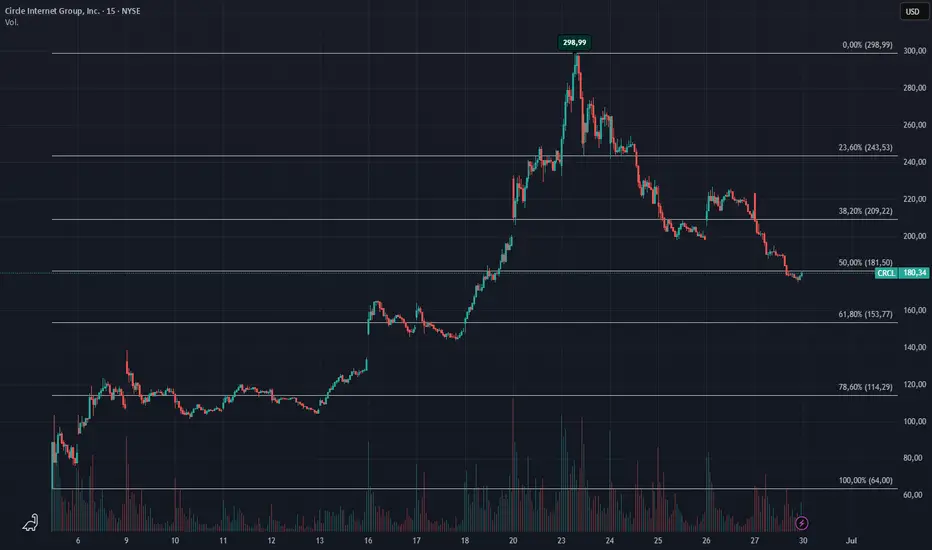
From that initial low of USD 64, the stock experienced a remarkable rally, reaching a high of USD 298.99 on Monday the 23rd. However, from that peak, a sharp correction began, bringing the price down in just a few days to test the 50% Fibonacci retracement level at USD 181.50, with a closing price this Friday of USD 180.43.
🔍 Key technical levels to watch
Key resistance levels:
USD 209.22 (38.2% Fib)
USD 243.53 (23.6% Fib)
Support levels:
USD 181.50 (50% Fib) – current level
USD 153.77 (61.8% Fib)
USD 114.29 (78.6% Fib)
📈 Possible scenarios for next week
➡️ Bullish scenario:
If buyers can defend the USD 181 level, we might see a bounce that triggers a third bullish wave, targeting USD 209, then USD 243, and potentially retesting the highs near USD 298.
If that level is broken, Fibonacci extensions project further targets around USD 388 and 444.
➡️ Bearish scenario:
If selling pressure prevails and the price clearly breaks below USD 181, we could see the correction extend toward USD 153, or even deeper if the short-term bullish structure breaks down.
💡 What's next?
Are we witnessing a technical bounce at a key level and the start of a new impulsive phase for CRCL?
Or will the correction deepen toward the 61.8% level or beyond?
📌 Share your analysis in the comments.
Are you #TeamBulls or #TeamBears on CRCL?
CRCL?
Circle Internet Group, Inc. (CRCL) began trading this June following its initial public offering at USD 32 per share. On its debut (Thursday the 5th), the stock doubled, opening at USD 64 and closing at USD 83.23, marking a strong start for this new NYSE ticker.
From that initial low of USD 64, the stock experienced a remarkable rally, reaching a high of USD 298.99 on Monday the 23rd. However, from that peak, a sharp correction began, bringing the price down in just a few days to test the 50% Fibonacci retracement level at USD 181.50, with a closing price this Friday of USD 180.43.
🔍 Key technical levels to watch
Key resistance levels:
USD 209.22 (38.2% Fib)
USD 243.53 (23.6% Fib)
Support levels:
USD 181.50 (50% Fib) – current level
USD 153.77 (61.8% Fib)
USD 114.29 (78.6% Fib)
📈 Possible scenarios for next week
➡️ Bullish scenario:
If buyers can defend the USD 181 level, we might see a bounce that triggers a third bullish wave, targeting USD 209, then USD 243, and potentially retesting the highs near USD 298.
If that level is broken, Fibonacci extensions project further targets around USD 388 and 444.
➡️ Bearish scenario:
If selling pressure prevails and the price clearly breaks below USD 181, we could see the correction extend toward USD 153, or even deeper if the short-term bullish structure breaks down.
💡 What's next?
Are we witnessing a technical bounce at a key level and the start of a new impulsive phase for CRCL?
Or will the correction deepen toward the 61.8% level or beyond?
📌 Share your analysis in the comments.
Are you #TeamBulls or #TeamBears on
Похожие публикации
Отказ от ответственности
Информация и публикации не предназначены для предоставления и не являются финансовыми, инвестиционными, торговыми или другими видами советов или рекомендаций, предоставленных или одобренных TradingView. Подробнее читайте в Условиях использования.
Похожие публикации
Отказ от ответственности
Информация и публикации не предназначены для предоставления и не являются финансовыми, инвестиционными, торговыми или другими видами советов или рекомендаций, предоставленных или одобренных TradingView. Подробнее читайте в Условиях использования.