Timeframe: 30-Minute Chart
Analysis Style: Price Action • Supply & Demand • Market Structure
________________________________________
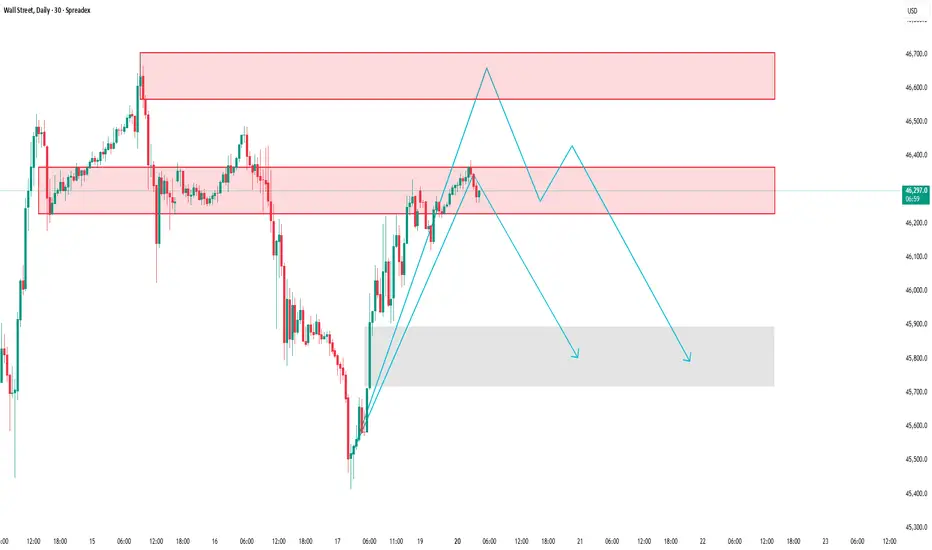
🧭 Market Context
After a strong rally from the lower demand zone, the Wall Street Index is now approaching a key supply area that previously triggered a sharp downward move.
At this level, sellers are beginning to step in again, and price momentum is starting to fade — suggesting a potential short-term correction ahead.
________________________________________
🧩 Market Structure & Key Zones
🔴 Supply Zone #1: 46,227 – 46,370
→ The first reaction zone, where previous selling pressure started a strong decline.
🔴 Supply Zone #2 (Major Resistance): 46,572 – 46,700
→ A higher zone where strong bearish momentum originated before.
🟢 Demand Zone: 45,900 – 45,700
→ A previous accumulation area that fueled the recent bullish leg — possible support zone if price pulls back.
________________________________________
📊 Current Price Behavior
Price has reached the 46,227 – 46,370 area and is showing signs of buyer exhaustion.
Multiple rejections and slower bullish candles near this level indicate a loss of momentum.
If the short-term bullish structure breaks, the market may shift toward a corrective phase.
________________________________________
📉 Trading Scenario
✅ Primary Scenario (Bearish Reaction Expected):
1. Price might retest 46,229–46,400 once more.
2. Failure to break above this level could lead to a downward “push.”
3. Target zone for the correction: 45,800 – 45,900.
⚙️ Alternative Scenario:
• If price closes clearly above 46,400, the short-term bearish setup becomes invalid.
• In that case, the next resistance to watch lies around 46,600 – 46,700.
________________________________________
💡 Conclusion
The Wall Street Index is currently testing a critical supply zone with visible signs of slowing momentum.
Unless bulls regain control above 46,400, the market may experience a short-term pullback toward the lower demand area.
This analysis is for educational and informational purposes only — not financial advice. Always confirm with your own price action and risk management strategy before making any trading decisions.
Please like and comment below to support our traders. Your reactions will motivate us to do more analysis in the future 🙏✨
Harry Andrew @ ZuperView
👉 Explore all indicators & systems: zuperview.com/
👉 Join our Discord: discord.gg/YKE6ujrw59
All content provided by ZuperView is for informational & educational purposes only. Past performance does not guarantee future results.
👉 Join our Discord: discord.gg/YKE6ujrw59
All content provided by ZuperView is for informational & educational purposes only. Past performance does not guarantee future results.
Отказ от ответственности
Все виды контента, которые вы можете увидеть на TradingView, не являются финансовыми, инвестиционными, торговыми или любыми другими рекомендациями. Мы не предоставляем советы по покупке и продаже активов. Подробнее — в Условиях использования TradingView.