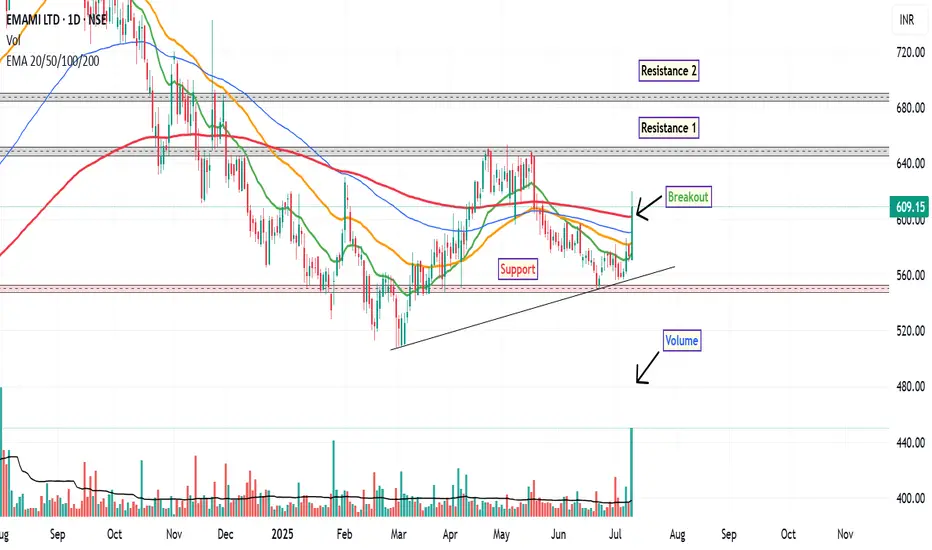
Following a prolonged downtrend that began in September 2024, EMAMI Ltd. has recently exhibited signs of a potential short-term trend reversal on the daily chart. The stock has demonstrated a notable uptick in momentum, marked by several key technical developments.
The stock has decisively moved above its 200-day EMA, a level often regarded as a long-term trend indicator. This breakout was accompanied by a significant increase in trading volume—approximately 5 times the average volume of the 50-day moving average, suggesting heightened market participation. The RSI has crossed above the 60 level, indicating strengthening bullish momentum, though it is approaching the overbought zone.
A bullish crossover in the MACD was observed, further supporting the case for near-term strength.
Around ₹600, where the stock is currently consolidating post-breakout. First resistance near ₹650, Second resistance around ₹690. A technical stop-loss could be considered below ₹548, aligning with recent swing lows and support levels.
Disclaimer: This analysis is intended solely for educational and informational purposes. It does not constitute investment advice or a recommendation to buy or sell any financial instrument. Market participants are encouraged to conduct their own research or consult with a qualified financial advisor before making any trading decisions.
Сделка закрыта: достигнута стоп-лосс цена
Stoploss Hit, Trade CloseОтказ от ответственности
Все виды контента, которые вы можете увидеть на TradingView, не являются финансовыми, инвестиционными, торговыми или любыми другими рекомендациями. Мы не предоставляем советы по покупке и продаже активов. Подробнее — в Условиях использования TradingView.
Отказ от ответственности
Все виды контента, которые вы можете увидеть на TradingView, не являются финансовыми, инвестиционными, торговыми или любыми другими рекомендациями. Мы не предоставляем советы по покупке и продаже активов. Подробнее — в Условиях использования TradingView.