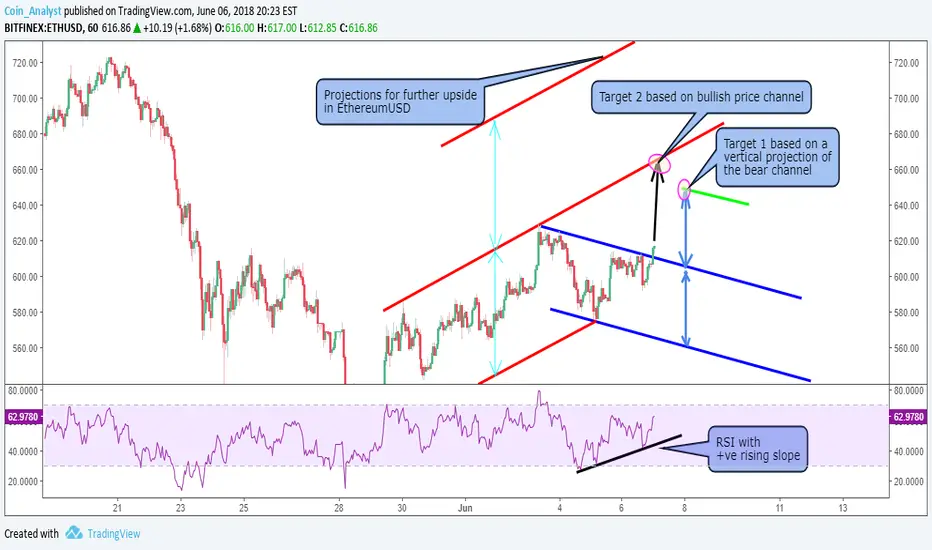
The 1hr tf chart of Ethereum (ETHUSD) as shown here captures the market action for Ethereum (ETHUSD) ever since price bottomed at ~ $511.64 on May 28, 2018.
The pink line is derived as a vertical projection of the top line (red) of the bullish channel. Further break to the upside past target 2 as shown on the chart could see Ethereum (ETHUSD) target the upper region of the pink line at ~$736.80.
Target 2 is based on price returning to the upper region of the current bullish channel and target 1 which is the most conservative is based on a vertical projection of the bear channel shown in blue.
RSI (relative strength index) as shown here has a positive rising slope and therefore implies further upside Momentum for Ethereum (ETHUSD)
Отказ от ответственности
Информация и публикации не предназначены для предоставления и не являются финансовыми, инвестиционными, торговыми или другими видами советов или рекомендаций, предоставленных или одобренных TradingView. Подробнее читайте в Условиях использования.
Отказ от ответственности
Информация и публикации не предназначены для предоставления и не являются финансовыми, инвестиционными, торговыми или другими видами советов или рекомендаций, предоставленных или одобренных TradingView. Подробнее читайте в Условиях использования.