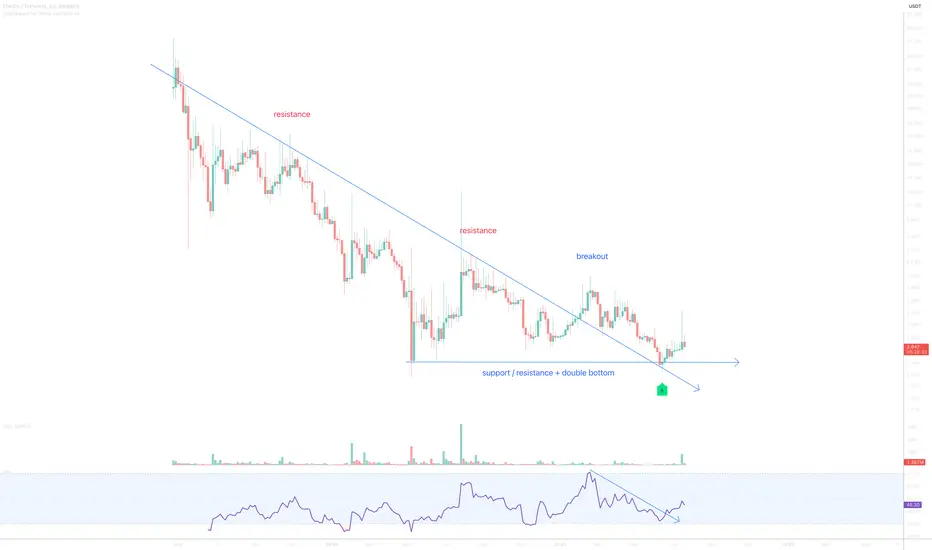
On the above 4-day chart price action has corrected over 90%. Today is great long opportunity. Why?
1) RSI and price action resistance breakouts.
2) Multiple oscillators print bullish divergence with price action.
3) Price action prints support on past resistance since breakout. Look left.
Is it possible price action falls further? Sure.
Is it probable? No.
Ww
Type: trade
Risk: <=6% of portfolio
Timeframe: Now, don’t sit on your hands.
Return: no idea
Сделка активна
Заметка
40%Заметка
an excellent momentСделка активна
Заметка
This one is a proper pump n dump, be careful. A long position from under 2.60 is great.
Заметка
Hold from under 2.60 until 5 dollaСделка активна
Well done if you grabbed the sellers tokens for cheap under 2.60.. they'll be seeing red once price action strikes 8 dollars.Сделка активна
GRM support confirmedСделка активна
Заметка
4.60 resistance confirms support.Заметка
Past resistance confirms support, prepare yourself.. boom is coming.Отказ от ответственности
Все виды контента, которые вы можете увидеть на TradingView, не являются финансовыми, инвестиционными, торговыми или любыми другими рекомендациями. Мы не предоставляем советы по покупке и продаже активов. Подробнее — в Условиях использования TradingView.
Отказ от ответственности
Все виды контента, которые вы можете увидеть на TradingView, не являются финансовыми, инвестиционными, торговыми или любыми другими рекомендациями. Мы не предоставляем советы по покупке и продаже активов. Подробнее — в Условиях использования TradingView.