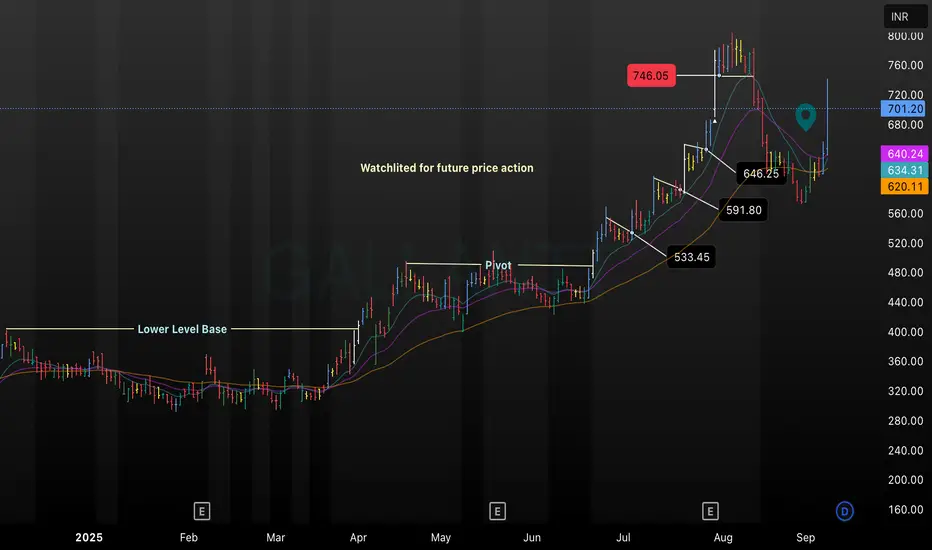
This chart analyzes Gallantt’s breakout momentum, highlighting the transition from a lower base to a sustained uptrend and pinpointing pivotal support levels at ₹533.45, ₹591.80, and ₹646.25. Moving averages show bullish alignment, with price action currently watchlisted for further movement above ₹701.20. The setup provides traders with actionable levels for both entry and risk management, ideal for monitoring continued strength or retracement opportunities.
Отказ от ответственности
Все виды контента, которые вы можете увидеть на TradingView, не являются финансовыми, инвестиционными, торговыми или любыми другими рекомендациями. Мы не предоставляем советы по покупке и продаже активов. Подробнее — в Условиях использования TradingView.
Отказ от ответственности
Все виды контента, которые вы можете увидеть на TradingView, не являются финансовыми, инвестиционными, торговыми или любыми другими рекомендациями. Мы не предоставляем советы по покупке и продаже активов. Подробнее — в Условиях использования TradingView.