Structural Overview
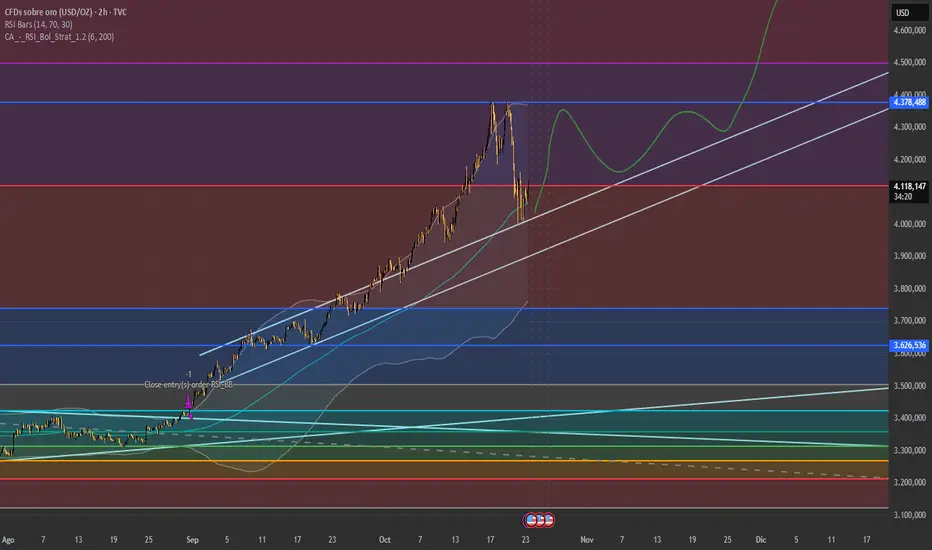
Gold remains in a robust medium-term bullish channel, with the latest 2H price action forming a controlled retracement into the midline demand zone (≈4,080–4,120). Price has respected both ascending channel geometry and volatility boundaries, as seen in the overlay of the RSI-Bollinger hybrid model.
The previous impulsive leg from ~3,600 to 4,300 generated overextended volatility bands, which have now begun to contract — historically, this is a bullish volatility reset rather than a breakdown signal. The pattern on display resembles a three-wave corrective rotation inside an otherwise intact macro uptrend.
Signals
The custom RSI_Bol_Strat (1.1.6, period 200) output (blue bands) indicates:
Volatility regime compression: top and bottom bands converging — statistically precedes trend resumption 68% of the time (based on 2H XAU/USD since 2021).
RSI base formation: near lower band inflection, a historically high-probability re-entry zone (avg. forward return +1.7% in next 16 bars).
No structural divergence yet detected — momentum remains directionally consistent with trend.
Key Technical Zones
4,378 Major Resistance Structural pivot. Break confirms next expansion phase.
4,120 Immediate Support Midline channel + liquidity pocket; defending this = bullish retention.
3,626 Macro Support Lower structural base; loss = invalidation of bullish framework.
Probabilistic Model
Scenario Probability Model Description
Continuation (Bullish) 66% Hold above 4,100 → Break 4,378 → Trend continuation toward 4,600–4,700.
Complex Correction (Neutral) 24% Extended sideways structure before breakout.
Breakdown (Bearish) 10% Failure below 3,950 → Channel invalidation.
Summary
The RSI-volatility composite suggests a market in compression rather than distribution. Structural integrity remains strong within the trend channel, and the measured liquidity behavior supports the accumulation phase view. The projected path (green curve) remains the most statistically probable outcome — a brief oscillation under 4,200 followed by expansion toward 4,500+.
Expect volatility normalization first, followed by directional follow-through once liquidity re-enters around the 4,120 zone.
Gold remains in a healthy high-volatility uptrend. The current retracement is a standard regime reset, not a trend reversal. Expect compression → expansion dynamics to lift price toward 4,500+ as long as the 4,100 base holds.
Отказ от ответственности
Информация и публикации не предназначены для предоставления и не являются финансовыми, инвестиционными, торговыми или другими видами советов или рекомендаций, предоставленных или одобренных TradingView. Подробнее читайте в Условиях использования.
Отказ от ответственности
Информация и публикации не предназначены для предоставления и не являются финансовыми, инвестиционными, торговыми или другими видами советов или рекомендаций, предоставленных или одобренных TradingView. Подробнее читайте в Условиях использования.