Although we have seen a mild reaction higher close to the 61.8% Fibonacci retracement level of $1,929, with the DXY (USD Dollar Index) highlighting scope for further buying interest, we could see further mild losses in Gold.
DXY: although we have broken out of the Ending Wedge formation to the downside, resulting in a mild negative bias, there is ample scope for intraday gains. Resistance levels of note are:
• the reverse trend line at 102.28.
• bespoke resistance at 102.55.
Furthermore, with bespoke support located at 101.78, we could also see dips being bought.
Reflecting this analysis back onto the yellow metal, we expect intraday volatility as we head into the US unemployment figures (Non-farm Payrolls).
Gold Daily chart: the Big Picture analysis is that we are heading lower within the BC leg of a large BAT formation. This has resulted in the medium-term bias being for higher levels towards the completion at $2,044.
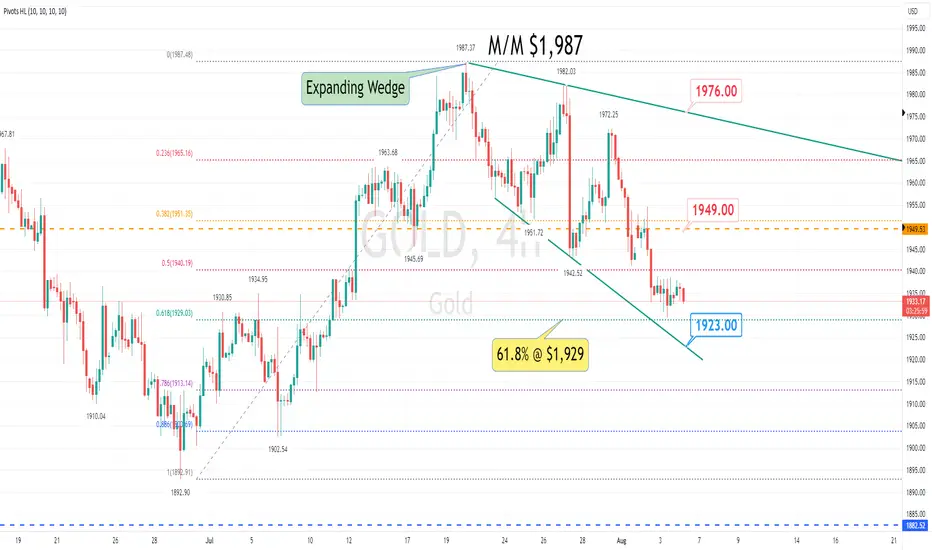
Gold 4-hour chart: mixed and volatile trading has resulted in an Expanding Wedge formation being posted. This is a bullish pattern and has an eventual bias to break to the upside. Although we have seen a mild reaction higher close to the 61.8% Fibonacci level of $1,929, using correlation, we could still see intraday dips.
Prime support is the trend of lower lows located at $1,923. Bespoke resistance is seen at $1,949. On a break of formation at $1,976, the correction lower is regarded as complete.
DXY: although we have broken out of the Ending Wedge formation to the downside, resulting in a mild negative bias, there is ample scope for intraday gains. Resistance levels of note are:
• the reverse trend line at 102.28.
• bespoke resistance at 102.55.
Furthermore, with bespoke support located at 101.78, we could also see dips being bought.
Reflecting this analysis back onto the yellow metal, we expect intraday volatility as we head into the US unemployment figures (Non-farm Payrolls).
Gold Daily chart: the Big Picture analysis is that we are heading lower within the BC leg of a large BAT formation. This has resulted in the medium-term bias being for higher levels towards the completion at $2,044.
Gold 4-hour chart: mixed and volatile trading has resulted in an Expanding Wedge formation being posted. This is a bullish pattern and has an eventual bias to break to the upside. Although we have seen a mild reaction higher close to the 61.8% Fibonacci level of $1,929, using correlation, we could still see intraday dips.
Prime support is the trend of lower lows located at $1,923. Bespoke resistance is seen at $1,949. On a break of formation at $1,976, the correction lower is regarded as complete.
Отказ от ответственности
Все виды контента, которые вы можете увидеть на TradingView, не являются финансовыми, инвестиционными, торговыми или любыми другими рекомендациями. Мы не предоставляем советы по покупке и продаже активов. Подробнее — в Условиях использования TradingView.
Отказ от ответственности
Все виды контента, которые вы можете увидеть на TradingView, не являются финансовыми, инвестиционными, торговыми или любыми другими рекомендациями. Мы не предоставляем советы по покупке и продаже активов. Подробнее — в Условиях использования TradingView.